
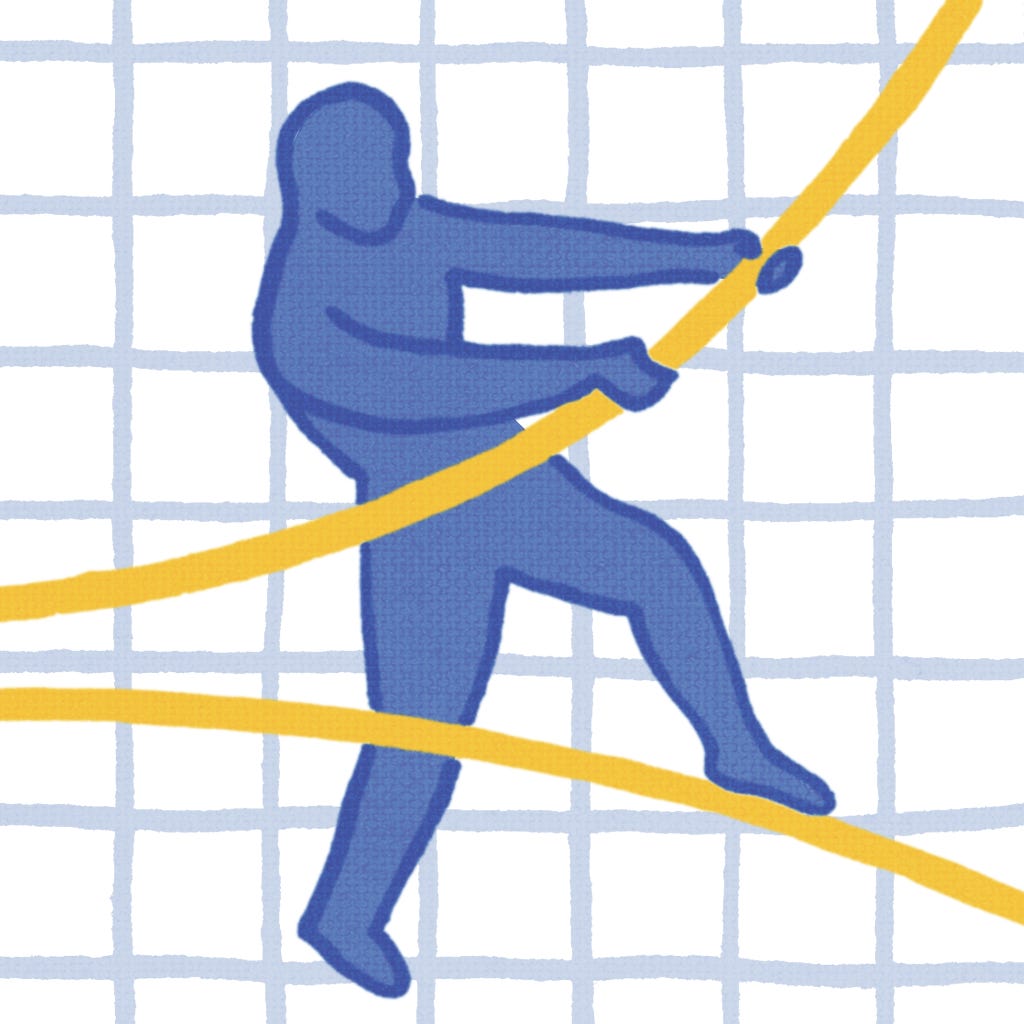
Chartography
Obsessed with data graphics—written for people who care about how charts earn trust.
What is Chartography?
Chartography is a weekly newsletter by RJ Andrews about charts, diagrams, and maps—their craft, their history, and their high‑stakes practice.
Some posts are short field notes. Others are deep dives. All of them are built around a simple idea: Good graphics don’t just explain. They change what people can see.
Start here
If you’re here for…
1. Work with RJ (high‑stakes charts)
I design and advise on graphics used for real decisions: executive communication, public-facing information, and complex internal tooling—always with clarity, credibility, and audience impact as the goal.
2. Chartography (this newsletter)
Weekly posts on information design—sometimes practical, sometimes historical, always grounded in making graphics that hold up under pressure.
3. Publishing (books + prints)
I publish books and prints through Visionary Press, celebrating the craft and history of data graphics.
What you’ll get
Here are the main kinds of posts you can expect:
High‑stakes practice: how decisions change when the graphic changes
Design craft: composition, annotation, framing, color, typography, restraint
History + artifacts: surprising old charts, forgotten methods, and what still works
Field notes: tools, workflows, production tricks, and “why this works” breakdowns
If you’re new, here are a few recent reader favorites:


Cadence: weekly-ish (with occasional bonus posts).
About RJ Andrews
RJ Andrews designs high‑stakes charts, diagrams, and maps—and publishes books and prints celebrating the craft and history of data graphics.
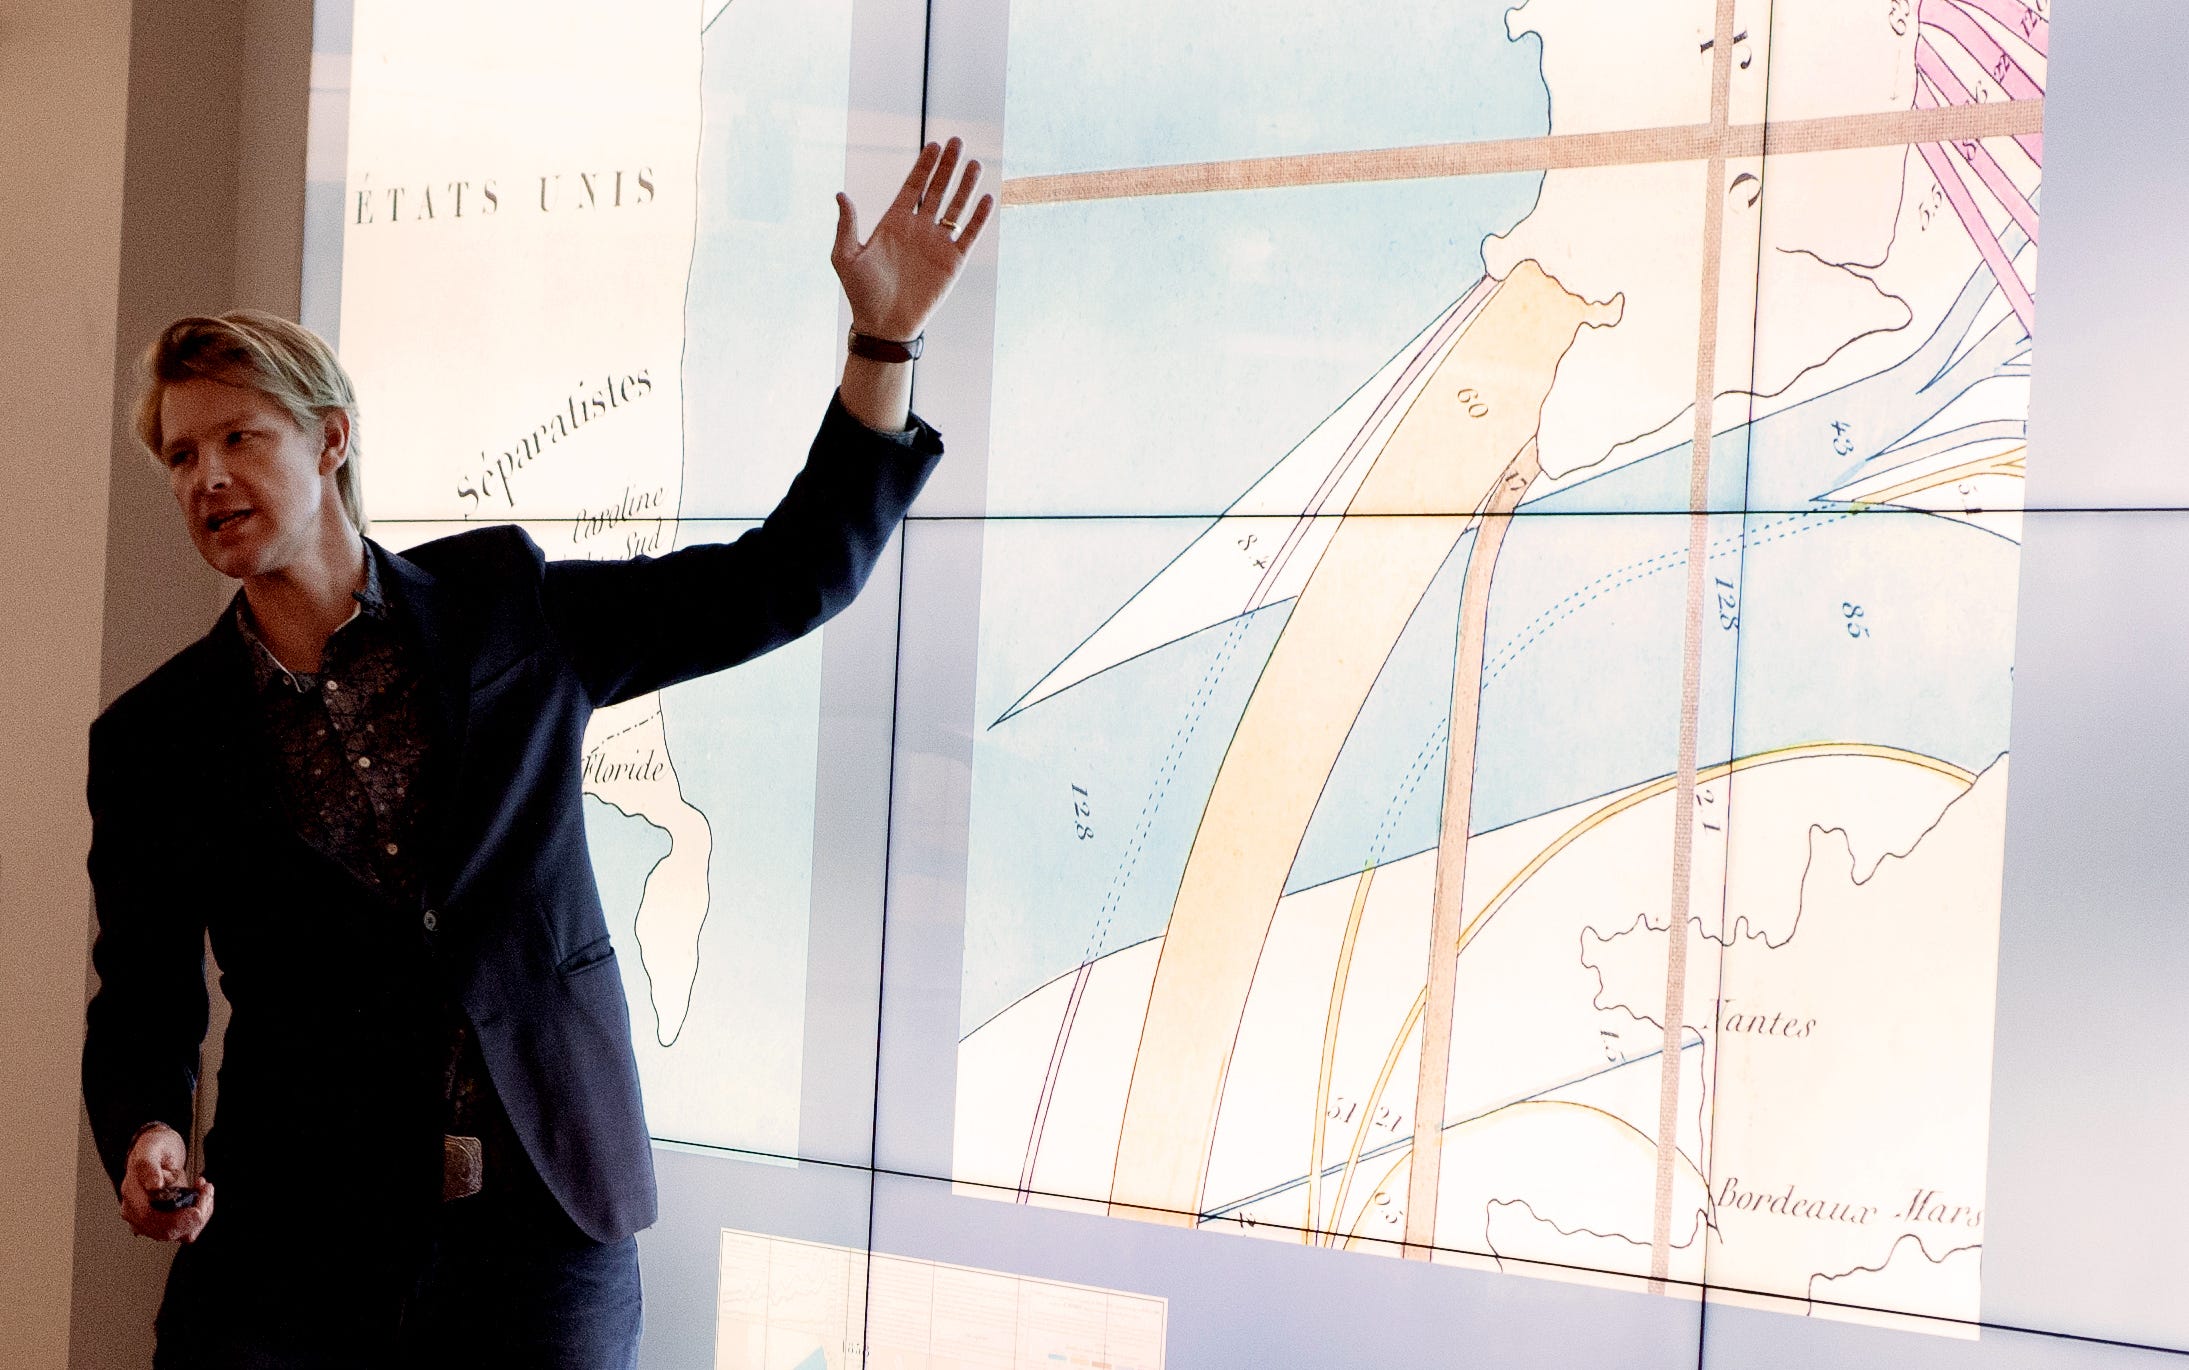
His work began at the MIT Media Lab, moved through academic medicine, and later returned to public health—producing daily graphic reporting work during the pandemic. His latest book is Info We Trust, Remastered—a “love letter to data storytelling.”
RJ also maintains the Andrews Collection of Information Graphics (San Francisco): rare and unusual books that reveal how people have tried—across centuries—to see the world more clearly.
Free vs. paid
Free subscribers get the weekly post and occasional announcements.
Paid subscribers keep Chartography possible—and unlocks deeper work including occasional extras.
Founding subscribers are patrons of the craft. If you’re in this tier: thank you—you’re underwriting the time required to do the work carefully.
A note on trust
I try to practice what I preach: clarity over hype, substance over noise. I don’t want to waste your time, and I don’t want to treat your attention as a commodity.
If you ever want to reply with a question, a chart you love, or a design problem you’re stuck on—I read responses.
More: Portfolio • Services • Visionary Press • Instagram • Bluesky
