Information Graphic inspiration from Info We Trust #038
Information Graphic Inspiration #038
Nightingale! + Dromogrpahe planétaire + Northeastern U talk
Florence Nightingale
I delivered my first public talk about Florence Nightingale's at the first conference hosted by the Data Visualization Society (DVS website): OUTLIER.
The 20 minute tour through the history and craft of these famous diagrams is the product of two years of my research. I am absolutely delighted by the audience's enthusiastic response and EXCITED to let you know that the talk is now published for you to enjoy:

This week's inspiration: Dromogrpahe Planétaire
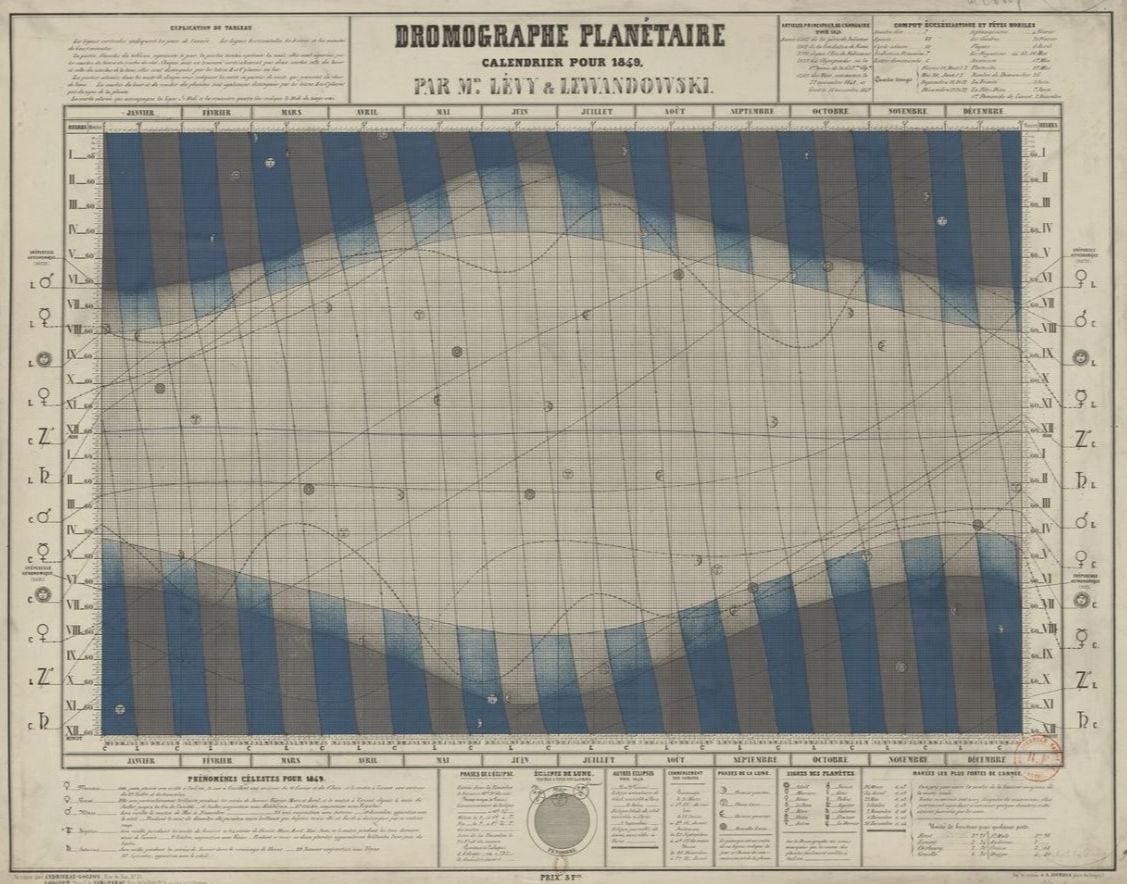
A dromogrpah is an instrument for recording the apparent path of anything in the atmosphere. Lévy and Lewandowski published their Dromographe Planétaire for the year 1849:

The color gradients and textures are absolutely superb. They combine with the curved paths to create a carnival-like canvas for the planet paths.


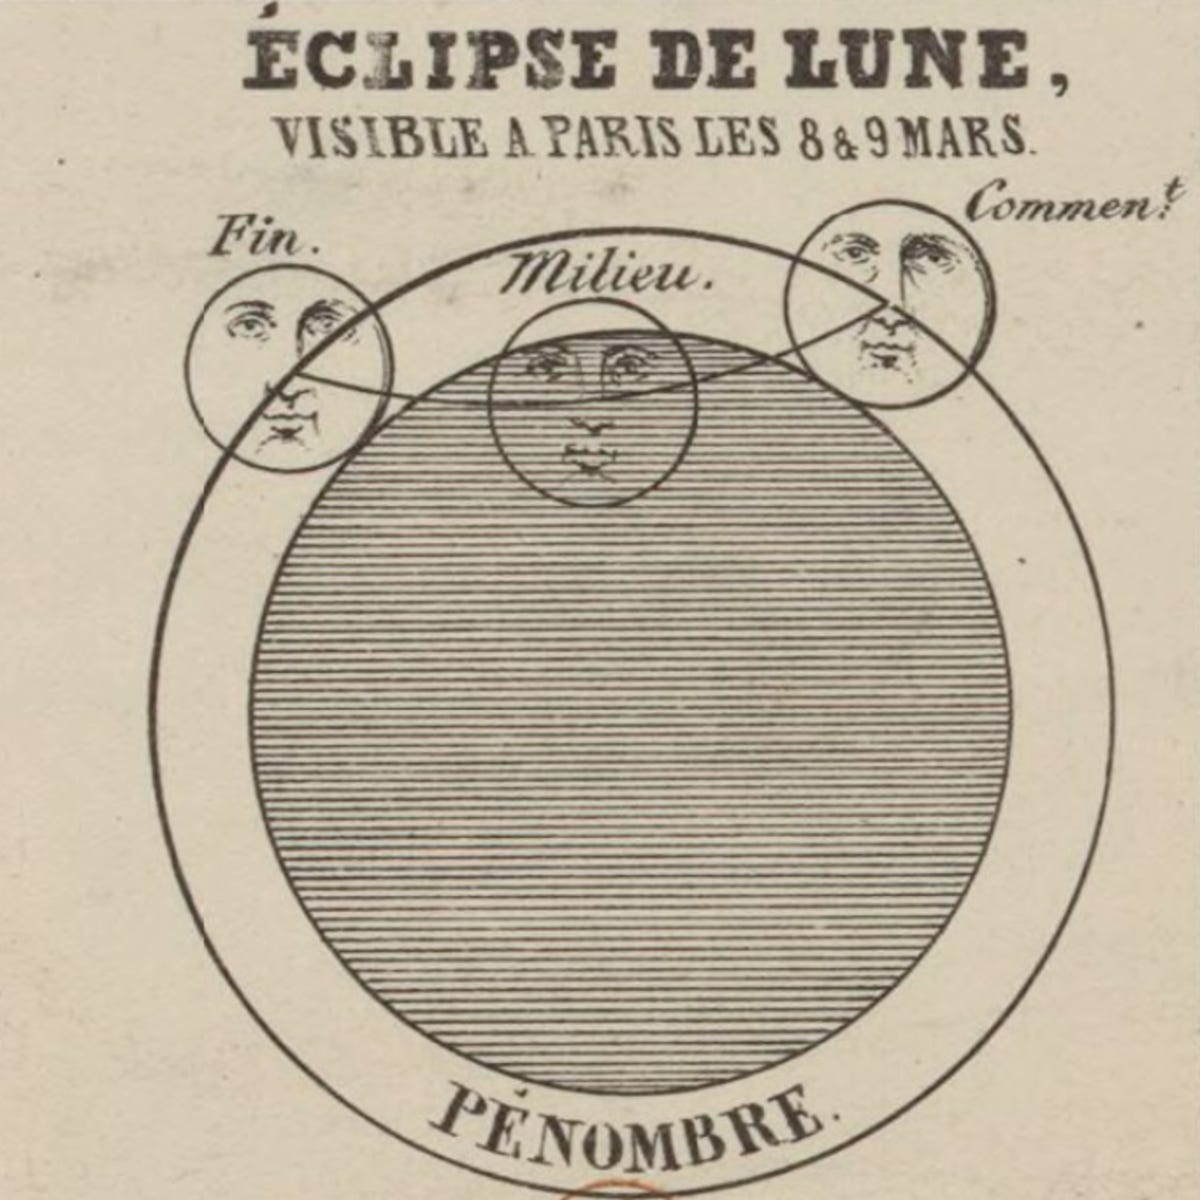
I also love the anthropomorphism throughout!

I discovered this chart via Étienne-Jule Marey, who references it in his Graphic Method (La Méthode Graphique, 1878). There is so much to see in this one, enjoy the original in HD via the BnF (Bibliothèque nationale de France): link
Data Visualization is a Craft
I am excited to return to my alma mater, Northeastern University, on April 7 to deliver an hour of programming exploring information graphics that inspire. You will see how maps, charts, and diagrams from yesterday can help us better understand and improve today. Register for the free talk:

I'm posting more and more historic information graphics + some new experimental stuff on Instagram. I like how easy breezy it is! See you there?

New publication announcements are on the horizon... until then—
Onward! -RJ
Like inspiration? See more at Info We Trust:


