
"A Saner and Richer Civilization"
Karl G. Karsten's 1923 prophetic hopes.

Welcome to Chartography.net — insights and delights from the world of data storytelling.
This summer, we are showcasing a series of historic writing about information design. It is the SUMMER OF CLARITY! These essay inspired the blue marginalia in my new book Info We Trust ($39 from Visionary Press).
Today, enjoy the coda to Karl G. Karsten’s 734-page Charts and Graphs (1923), where his feverish hopes for new chart forms include predictions of data sonification and slow-reveal graphs. His text is augmented with graphics from the book.
The Function of Charts
A world turning to a saner and richer civilization will be a world turning to charts. From this conclusion, unwelcome as it may be, there is no escape. The case for the chart may even be sketched in a few schoolboy syllogisms, woven through the related ideas; civilization, clean-cut thinking; precision of thought, numerical statements; statistics, charts. With the last step in this chain, this book has attempted to deal. With a brief summary of statistical data the last chapter has provided us. There is no need to dwell upon the importance of precise, clear thinking, either in business or in economic studies. It remains to glance ahead a bit at the mechanics of the relations which charts will assume with the civilized world at large, and to venture a few predictions as to the nature of these relations.
And for this larger view it seems well to begin by amplifying our original definition. A chart is an image or graphic representation of abstract relations. Where these relations are not of a numerical nature, the chart is non-mathematical in character and is closely akin to the other graphic arts of a purely pictorial character; indeed its only distinction from paintings, photographs, and the like, appears to lie in the abstract nature of the ideas which it diagrammatically or schematically expresses. But where the relations are numerical and the subject of the chart is statistical, the chart is mathematical in character and forms a distinctly new branch of the graphic arts. While the artist will seek to present two groups of ten and twenty horses each by a picture of so many horses, placing his emphasis upon the realistic likeness of his drawing to horses, the chart-maker will seek to present the same objects by, let us say, two bars, which by their lengths express the numbers twenty and ten. His chart of horses will be exactly like his chart of two similar groups of ships, or his chart of two very much larger groups of horses in which the group proportions are unchanged. He can, indeed, with equal facility make a chart for groups of two million and one million horses, a task which would be beyond the powers of the artist.
In subject-matter, then, the chart is universal, and hence, too, in its potential appeal and usefulness. No one can think of two numbers and attempt to comprehend their significance without, at least unconsciously, visualizing them; the number which does not conjure up in our minds some picture of quantity remains meaningless to us.
In this sense, therefore, everyone who deals with numbers is already a chart-maker and a chart-user. We have no choice between the use of charts and the use of statistics; we have only a choice between the use of written or physical charts and the use of imagined or ‘‘mind’s-eye” charts. Often, indeed, the latter are sufficient, and many persons, it is true, still prefer under all circumstances to carry all the pictures of their numerical data in their minds. But for the careful study of important figures, or for the casual study of large bodies of important figures, this is obviously the less efficient method, and the physical record, the written or graphic chart, comes into service. It is more permanent, more convenient, and more accurate.
The technique of the chart is also, in a sense, wider than that of the other graphic arts; indeed, it comprises something of the technique of all the arts. The reader of this book has seen that we have drawn statistics with pictures, and sculpted them as models and we have reproduced them by photography and by lantern slides and by printing. In this we have freely used design, relief and color. It may not be too much to add that some day we shall set charts to music, to enhance their graphic value, evolving a musical expression of statistics. This will seem less improbable when we consider its use in the accompaniment of moving pictures of charts.
The animated chart, made possible by the motion-picture film, has long been a dream of the author. Its graphic value will be great in the presentation of fundamental economic facts to the general public, or of special statistics to special audiences. By its means the important chart can be presented in various stages of completion, and attention can be focused in turn upon each change, development, or addition to the picture. Thus in a bar-chart, the labels can appear first, then each bar, with its data, can appear, one after the other, until the bar chart is completed. Curves can be shown wiggling across co-ordinate rulings, with close-ups of each important added wiggle. Maps can appear first in outline and the shadings can appear and spread across the map by simple tricks of photography, and these shadings can be altered to show changing conditions for: successive points or periods of time. The “movie’’ of statistics is clearly coming, for schools and colleges, for the general public, for the scientific or academic meeting, and in business, for director’s meetings, for sales conventions, and for advertising purposes.
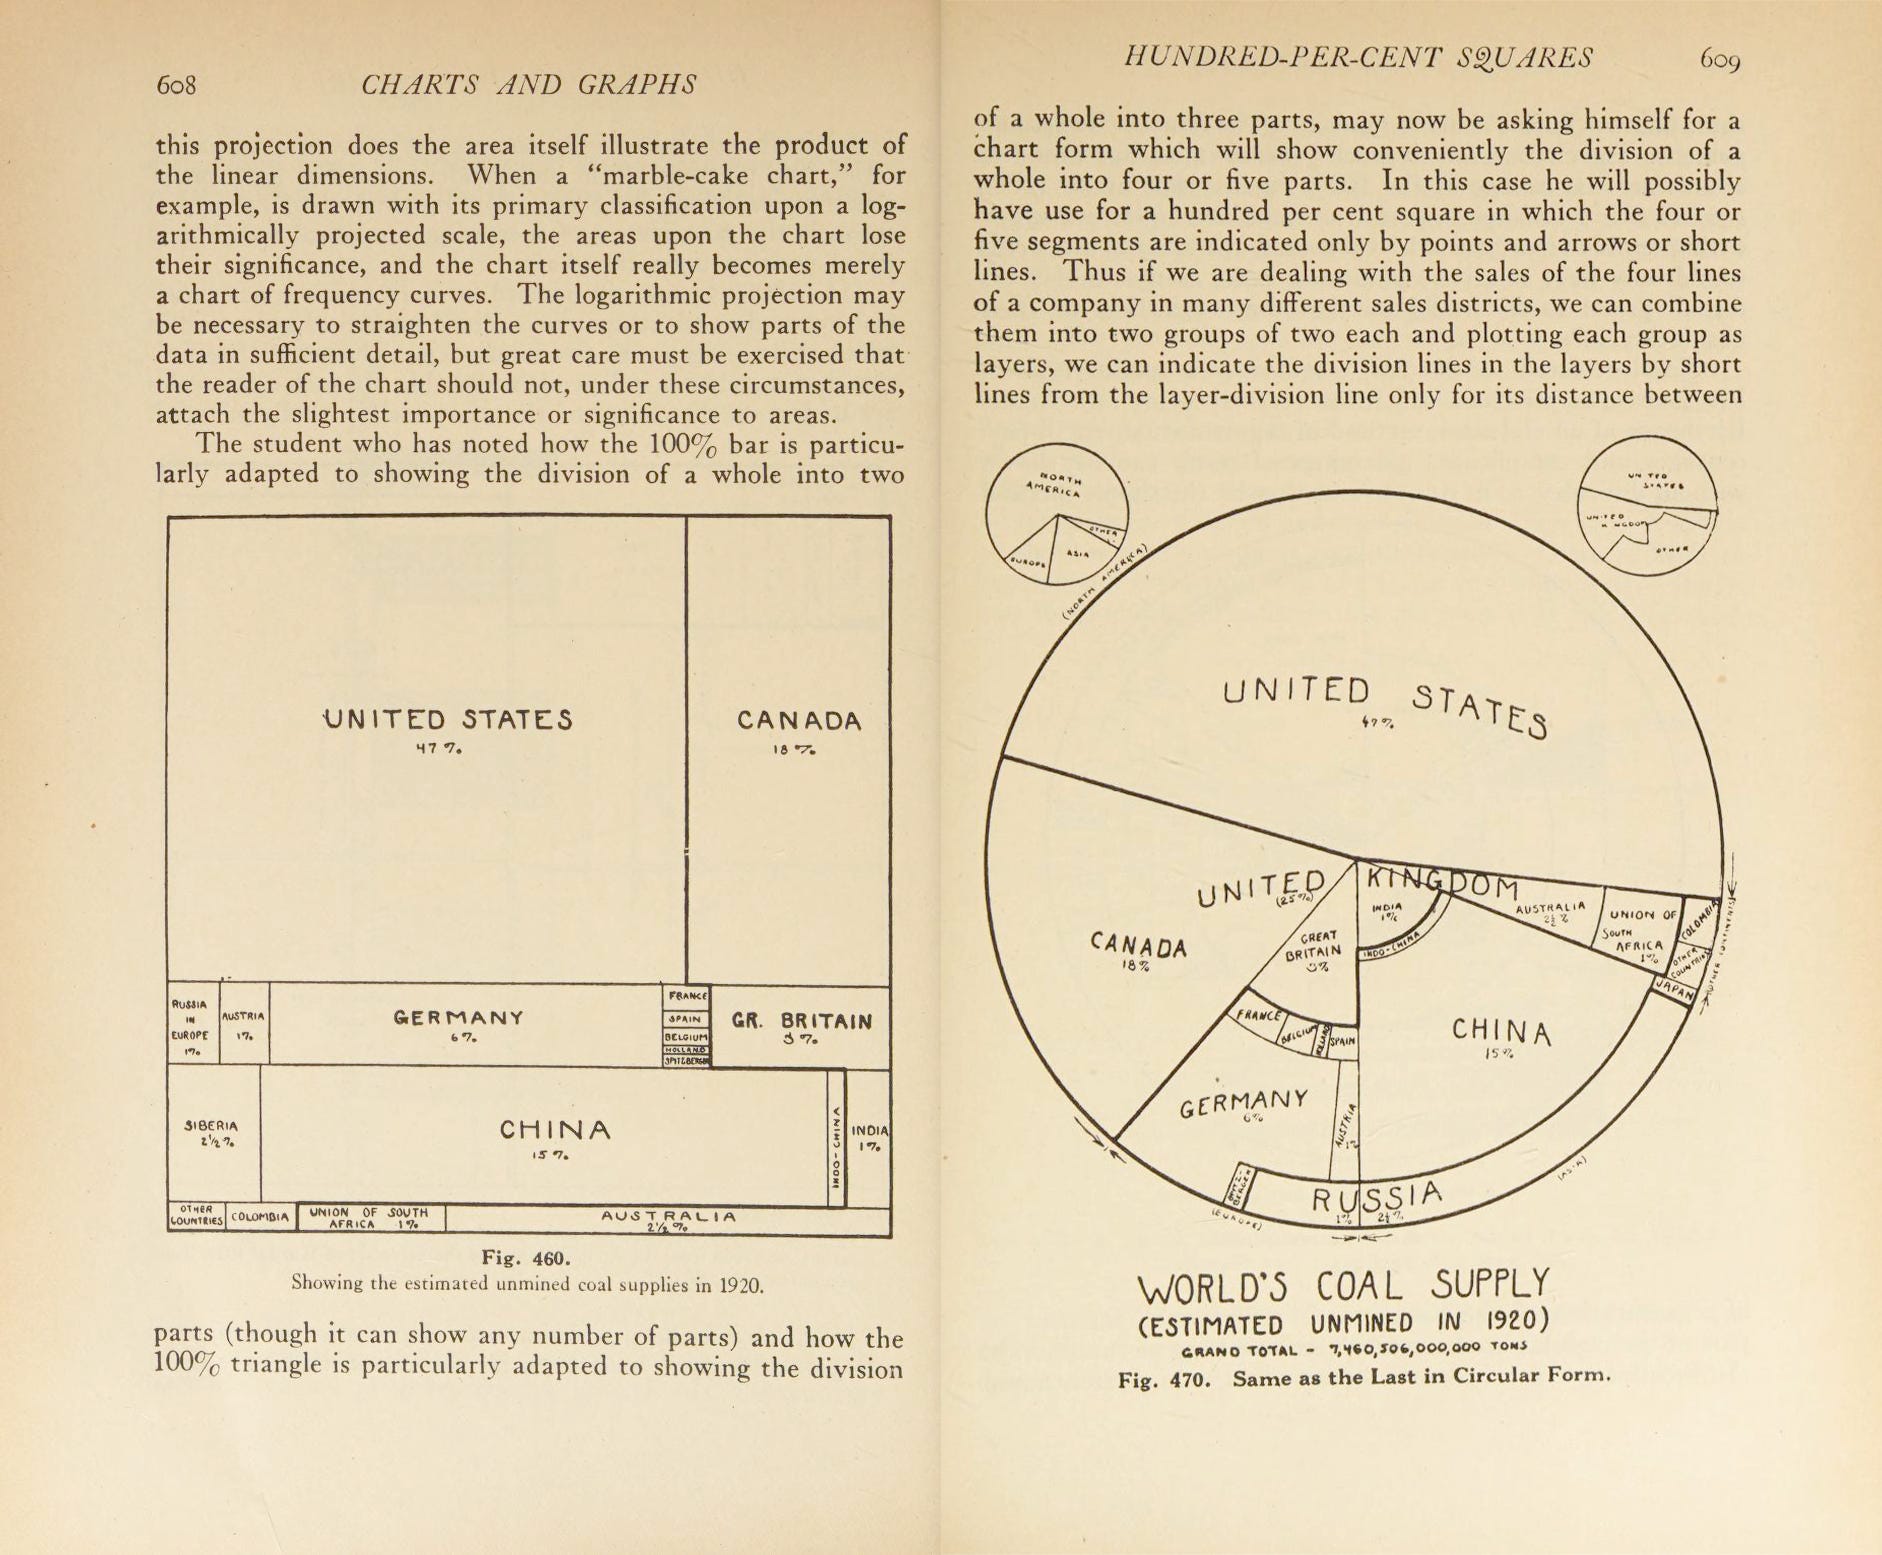
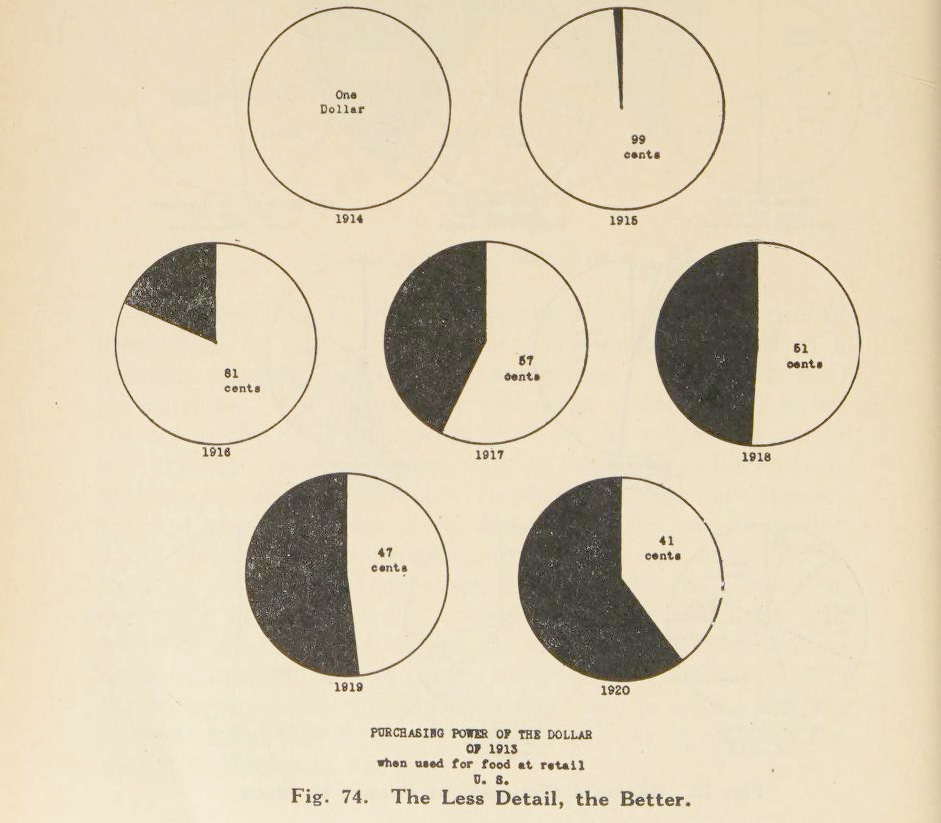
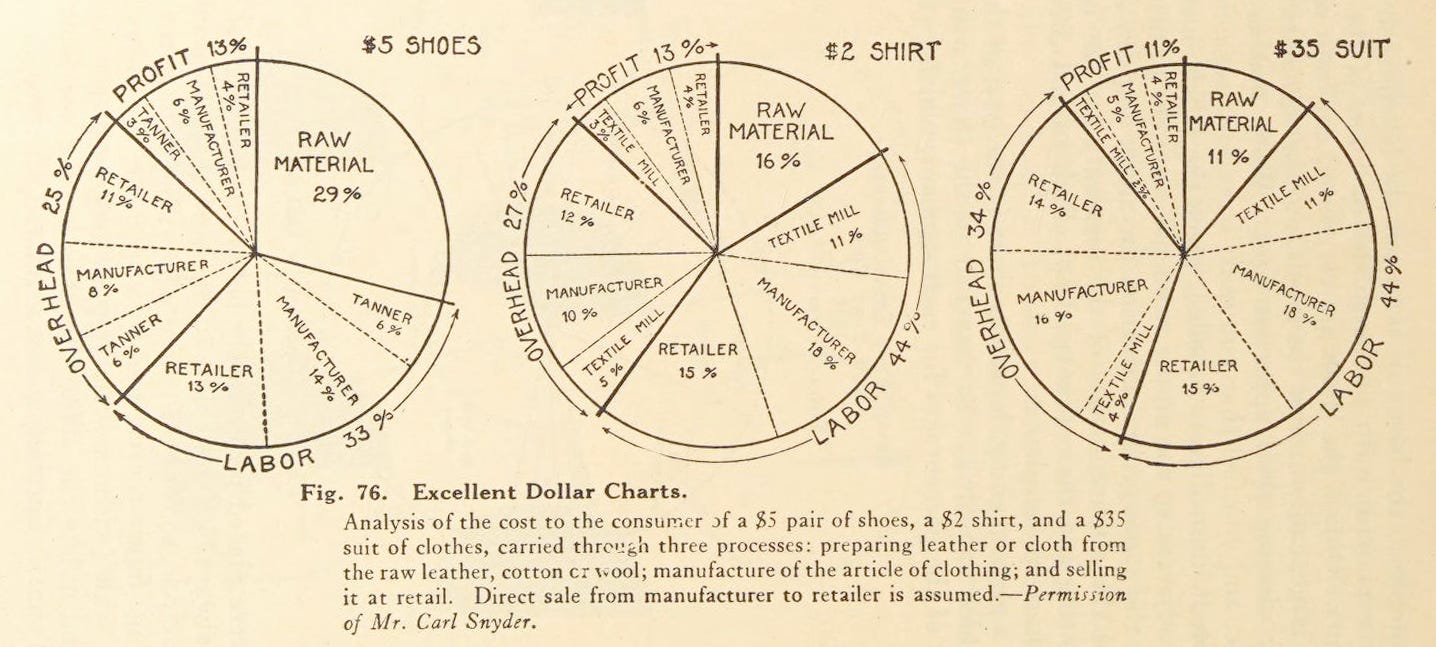
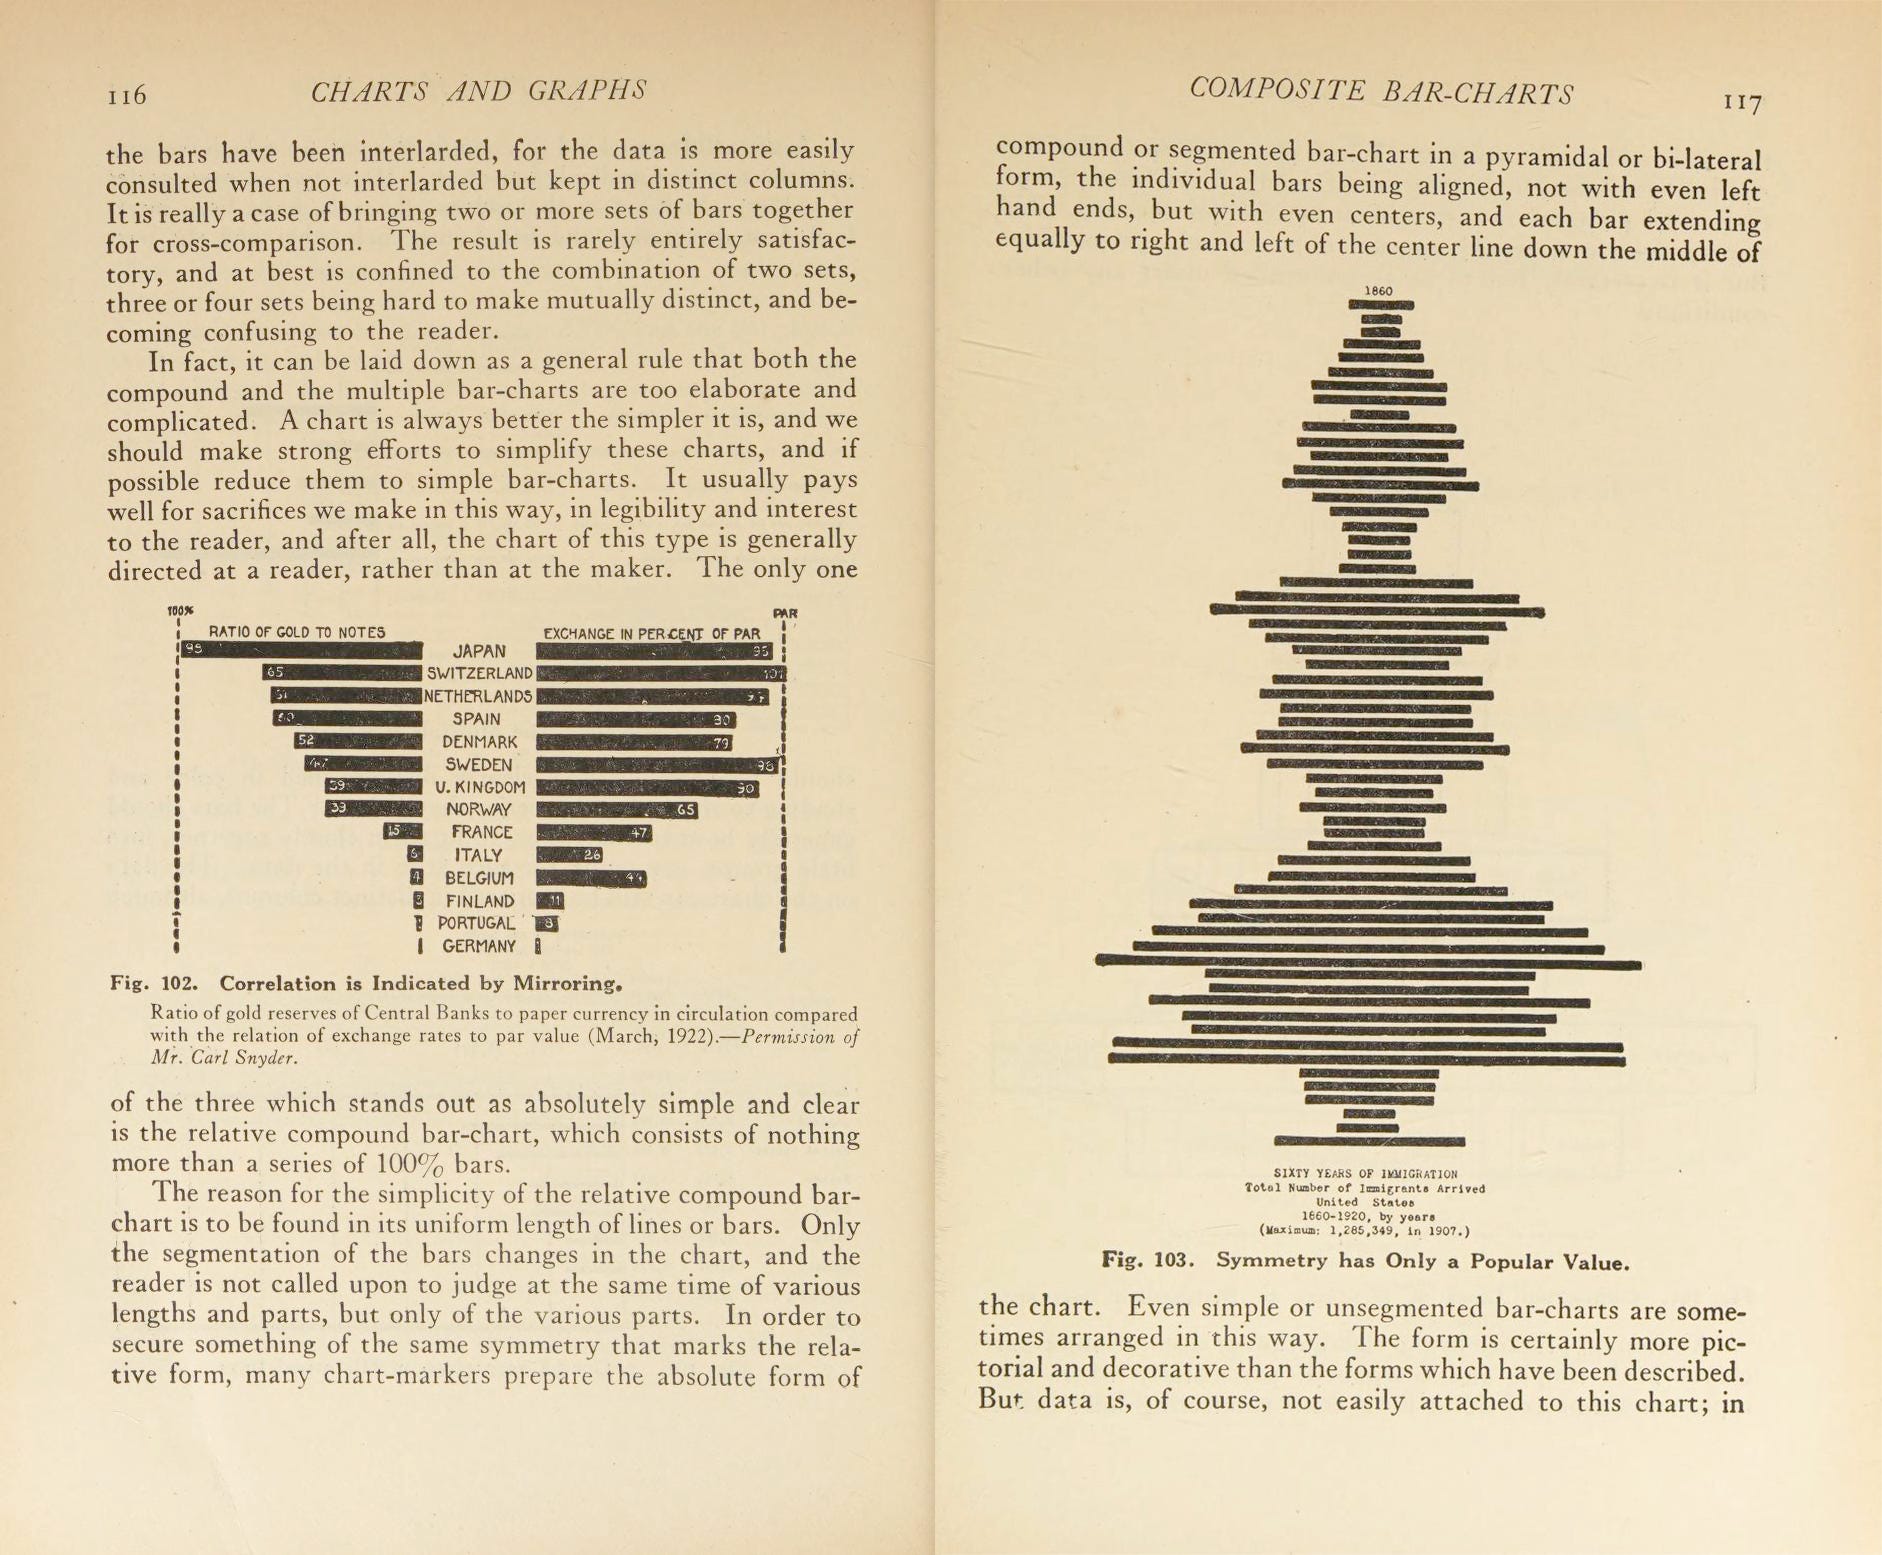
In all chart-making, a distinction which will become increasingly recognized is the distinction between charts for popular consumption and charts for research purposes. This is no more than adapting the chart to the audience for which it is intended. And there can be as many different proper charting ways as there are different degrees of familiarity with charts and ease in chart-reading. For extremely popular presentation, the pie-chart is always effective; bar-charts should be converted into series of circles and curves into vertical bars whenever possible. For more sophisticated readers the amount-of-change curve can be used; for the technical and semi-technical, the simpler forms of the rate-of-change curve are permissible. The probabilities and other special projections will be really understood only by the experts; and are essentially charts for internal consumption in the research laboratory.
Though everyone can be told how a bow is carried across a violin string, we do not expect all to play the violin well. And though the technique of chart-making can be simply explained, we cannot expect everyone to make good charts. The chief source of good charts will always be the statistical departments of large organizations. When the organization is an institution for the promotion of research in some special field, the statistical staff will of course be well manned. But the greatest strides, at least in chart-making, if not also in statistical methods, will in the future be made in the statistical departments of large business organizations.
In business the function of the statistician is two-fold, comprising on the one hand special research and investigations, and on the other hand, the co-ordination and intelligent reporting of current business operations. In both of these, charts are essential implements. In the research field the statistician has often a scouting function, his job being to look ahead and try to forecast the future development of the house and its markets. In the reporting field he assembles and interprets the operations of all the other departments; purchasing, production, shipment, warehousing, sales, and other collections; and of the business as a whole: inventories, costs, and profits. His position here is that of liaison or intelligence officer between the responsible head of the business and his subordinates, and also between the responsible subordinates and their departments. To get the fullest use of the expert intelligence in visualization and analysis, one of the vice-presidents may be himself a professional statistician and chart-maker of the highest specialized training, but in the past the average statistician has not often displayed a sufficiently practical viewpoint to justify this connection and the wealth of significance which lies in the records of the individual business house is untapped by those who must guide it.
Comparable to the lawyer who brings to the guidance of business enterprise an intimate knowledge of legal technicalities, is the business statistician who brings to it an intimate knowledge of statistical interpretation. In business houses where the operations and problems are of a standardized nature, his skill will not, except in very large concerns, be constantly needed and the statistician here becomes a consulting expert rather than a permanent officer. In such concerns the reporting procedure can be quickly set in motion and standardized, so that it can be carried on thereafter by clerks. The Gantt progress-charts and a few of the simpler curves and maps are all that need be installed, after the proper system of records from the accounting and other departments have been established. In business concerns of more variety of operations, the trained statistician is necessarily more of a permanent member of the personnel and the work of forecasting is likely to be seriously entered into. Here the widest variety of charts come into use, for a nice understanding of their graphic value and true significance is available. Here it is often profitable to maintain a special statistical “laboratory” with complete facilities for statistical sources, compilation and analysis and for graphic records.
. . .
Of a much more general nature are charts for popular consumption. ‘These are appearing with increased frequency in newspapers, general magazines, and technical publications. The day will come when no statistical compilation will be regarded as complete until it is illustrated with charts which present its major significance. The greatest development of charts, here, however, will take place in the advertising columns, and in general for propaganda work. For the proper chart is an excellent weapon against the inertia, indifference, and often hostile attitude of the average reader. It is not merely the best kind of eye-catcher for calling attention to numerical data, it is also the most convincing proof of that data. The most casual reader stops a moment before any diagrammatic puzzle to examine it. If he finds incidentally that he immediately understands it, he is perhaps at once pleased with it and is sure at least to carry away with him a memory of the message it conveyed. That such charts should be of the simplest, goes without saying; and here too, expert skill in chart-making is desirable. For the right chart is strong in inverse ratio to the technical ability of the reader, and the less effective would be text or tables, the more powerful grows the right chart.
In all fields, scientific, academic, and commercial, the chart is a medium of expression too forceful to be overlooked, too valuable to be neglected. Its future growth will assuredly be rapid and perhaps in many ways even startling. In this book we have set forth many ways for the presentation of statistics and statistical relations. The category is, however, by no means complete. It cannot be complete, for the charts are still in the making, and the methodology of graphic illustration is in no sense that of a perfected art. There is room for much improvement in existing chart-forms as well as in the development of altogether novel forms. New ideas will come out of the research laboratories, new methods, new forms, new charts. The distinction between graphs for popular publication to the general public and graphs for internal consumption in the statistical workshop, will become more marked; and as public knowledge increases, charts will pass out of the workshop into the magazine and book page, no less through advertising than through text columns.
We are finding a new language, the grammar of which is not yet completed, nor the dictionary written. It is well that this is so, for codification and systemization easily bring stagnation; and volumes such as the present, in which the existing material is set in order, must not be allowed to stifle new growth. The reader is urged not to permit the rules laid down in this book to restrict his efforts, but rather to allow the principles set forth to stimulate his imagination and enterprise. The pictorial display of mathematical and numerical statements is an illustrative art, with the high object of facilitating human understanding and vision, an end the achievement of which justifies all means, be they orthodox and accepted or novel and previously untried.᠅
Karl G. Karsten (1891–1968) was an American Rhodes Scholar, economist, statistician, businessman, inventor, and author known for his work on graphical methods and economic forecasting.
Read his Charts and Graphs: https://archive.org/details/chartsgraphsintr0000karl/page/n7/mode/2up
Let me know if you have suggested entries for future editions of THE SUMMER OF CLARITY.
About
RJ Andrews helps organizations solve high-stakes problems by using visual metaphors and information graphics: charts, diagrams, and maps. His passion is studying the history of information graphics to discover design insights. See more at infoWeTrust.com.
RJ’s book, Info We Trust, is currently out now! He also published Information Graphic Visionaries, a book series celebrating three spectacular data visualization creators in 2022 with new writing, complete visual catalogs, and discoveries never seen by the public.