A Third Double-Shot of Inspiration
Colorful partners from there and then.
Welcome to Chartography.net — insights and delights from the world of data storytelling.
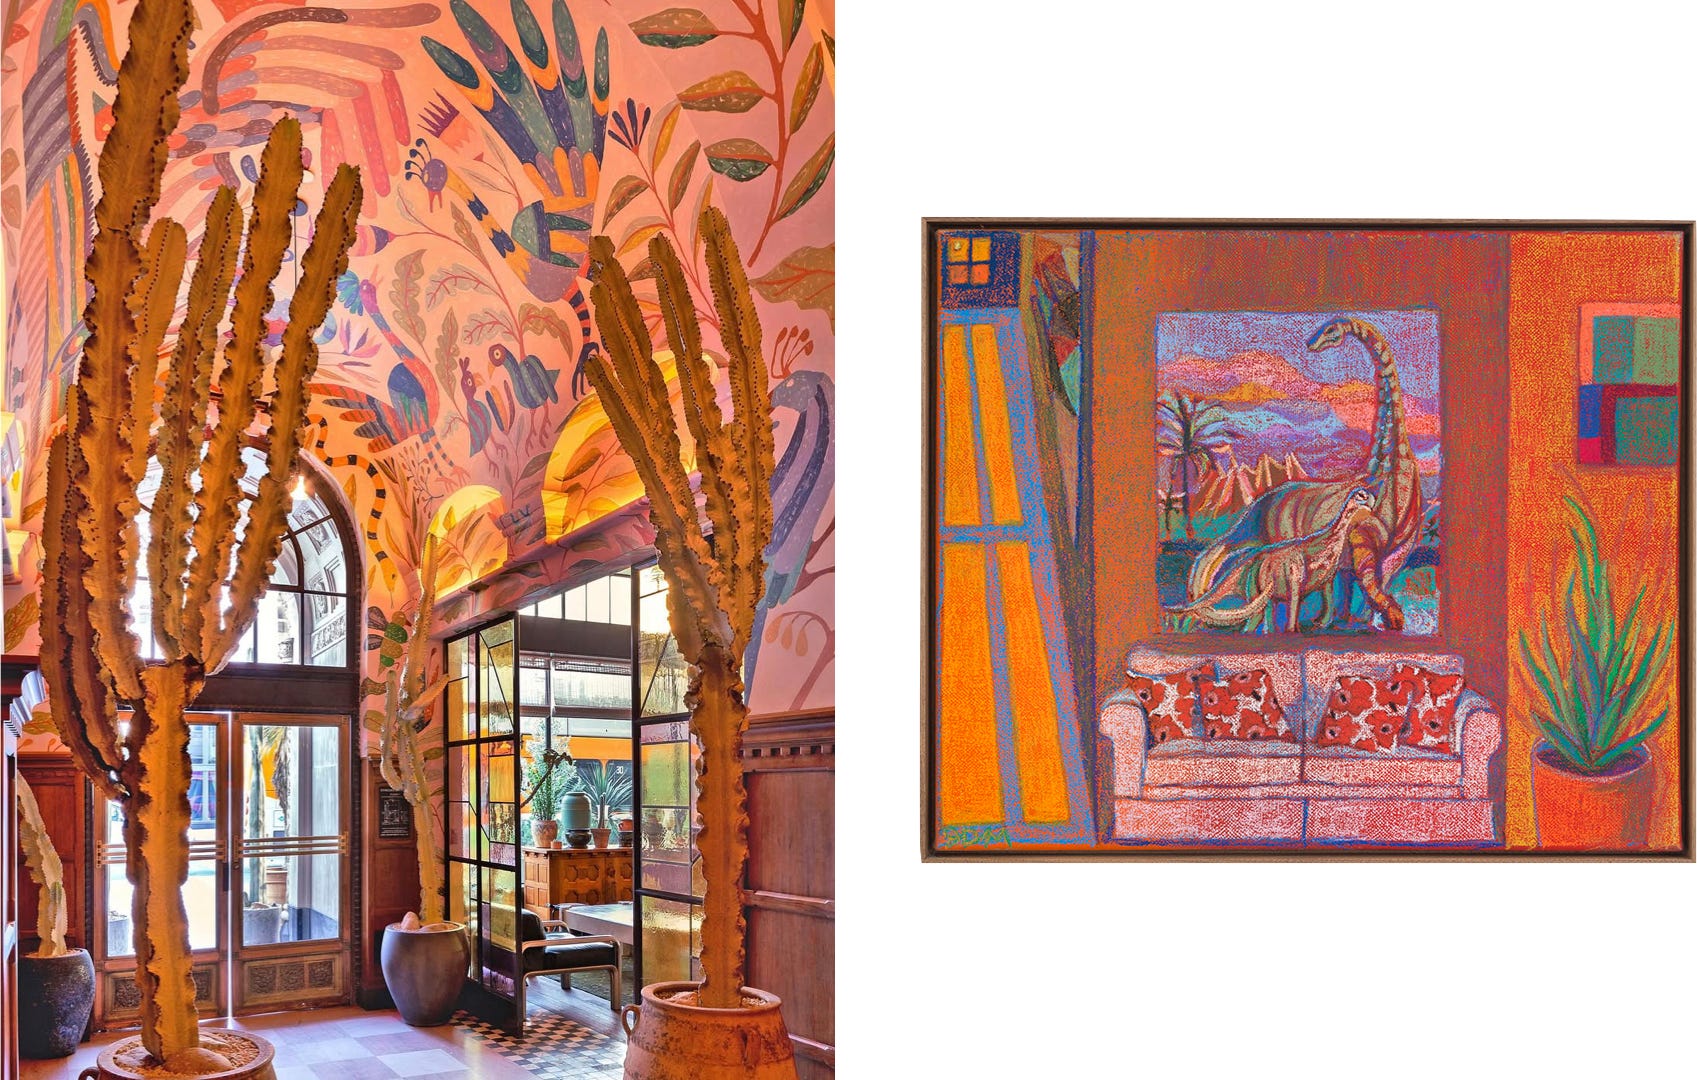
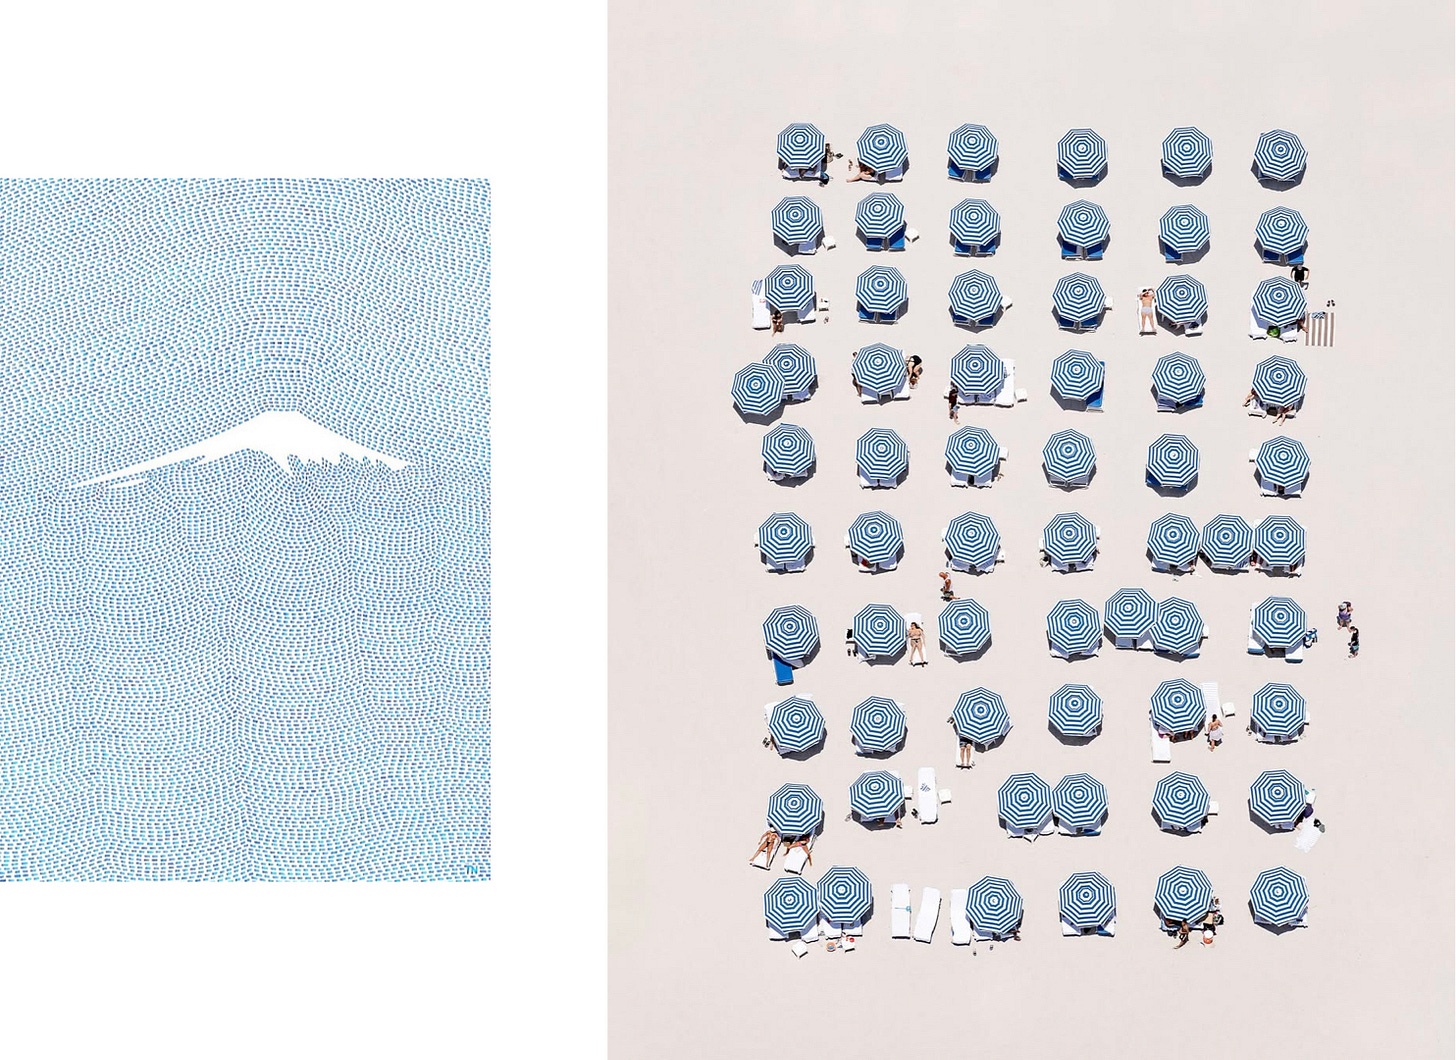
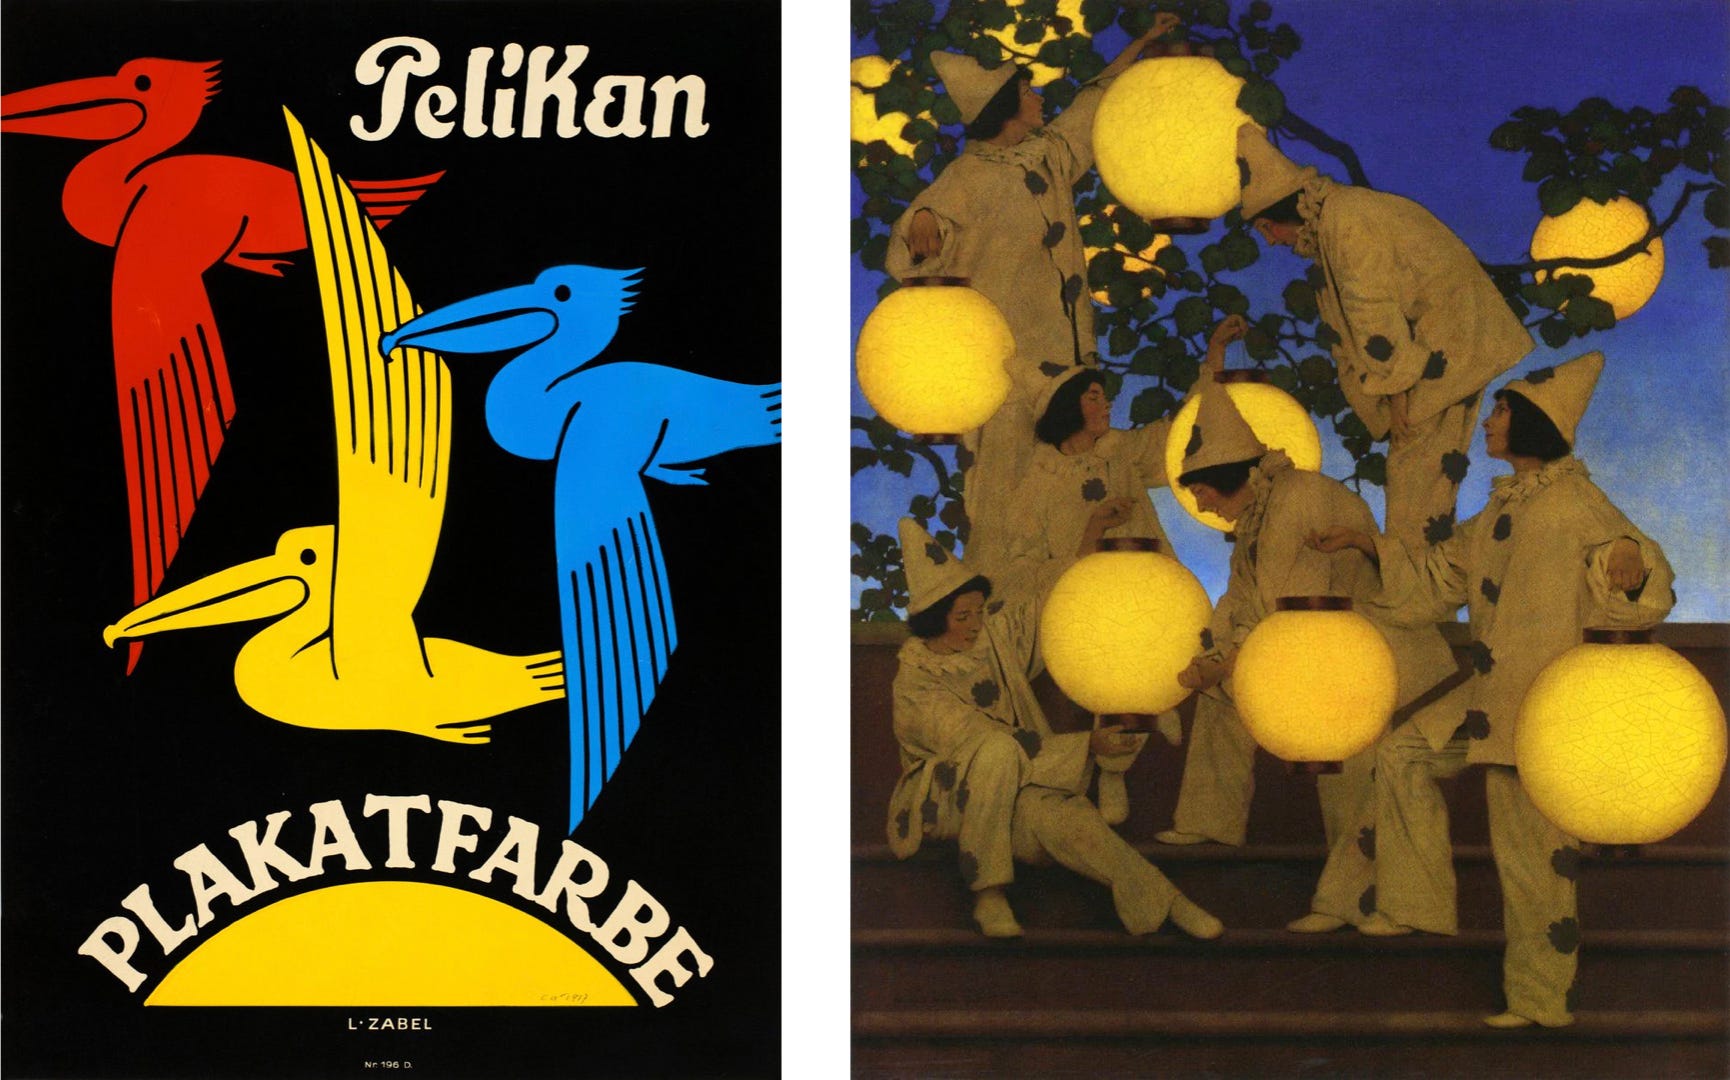
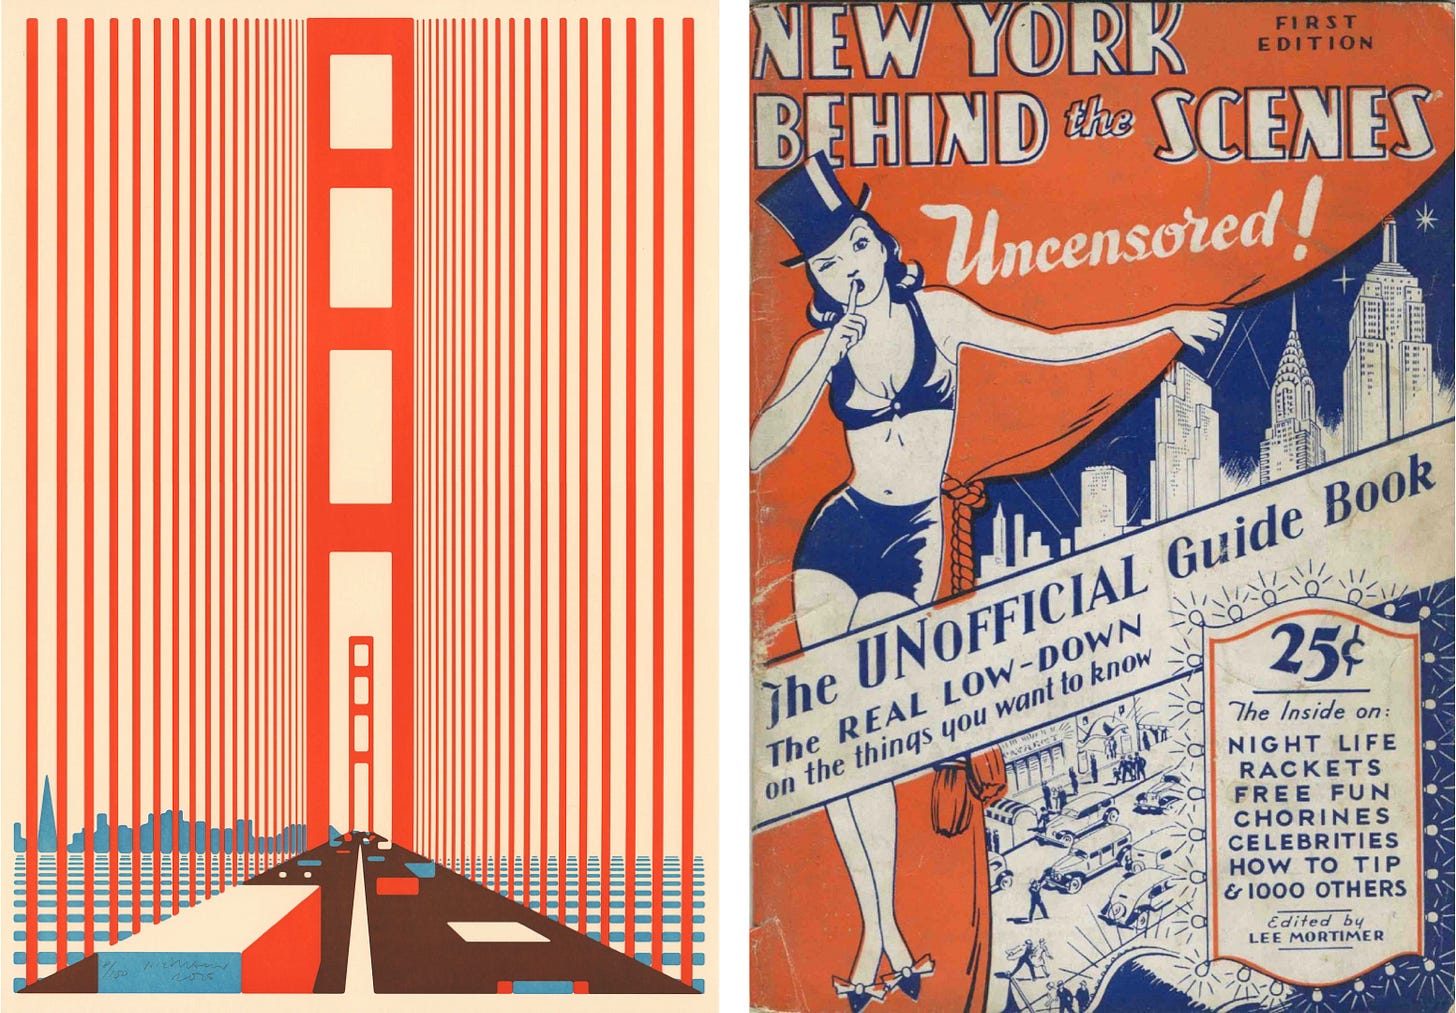
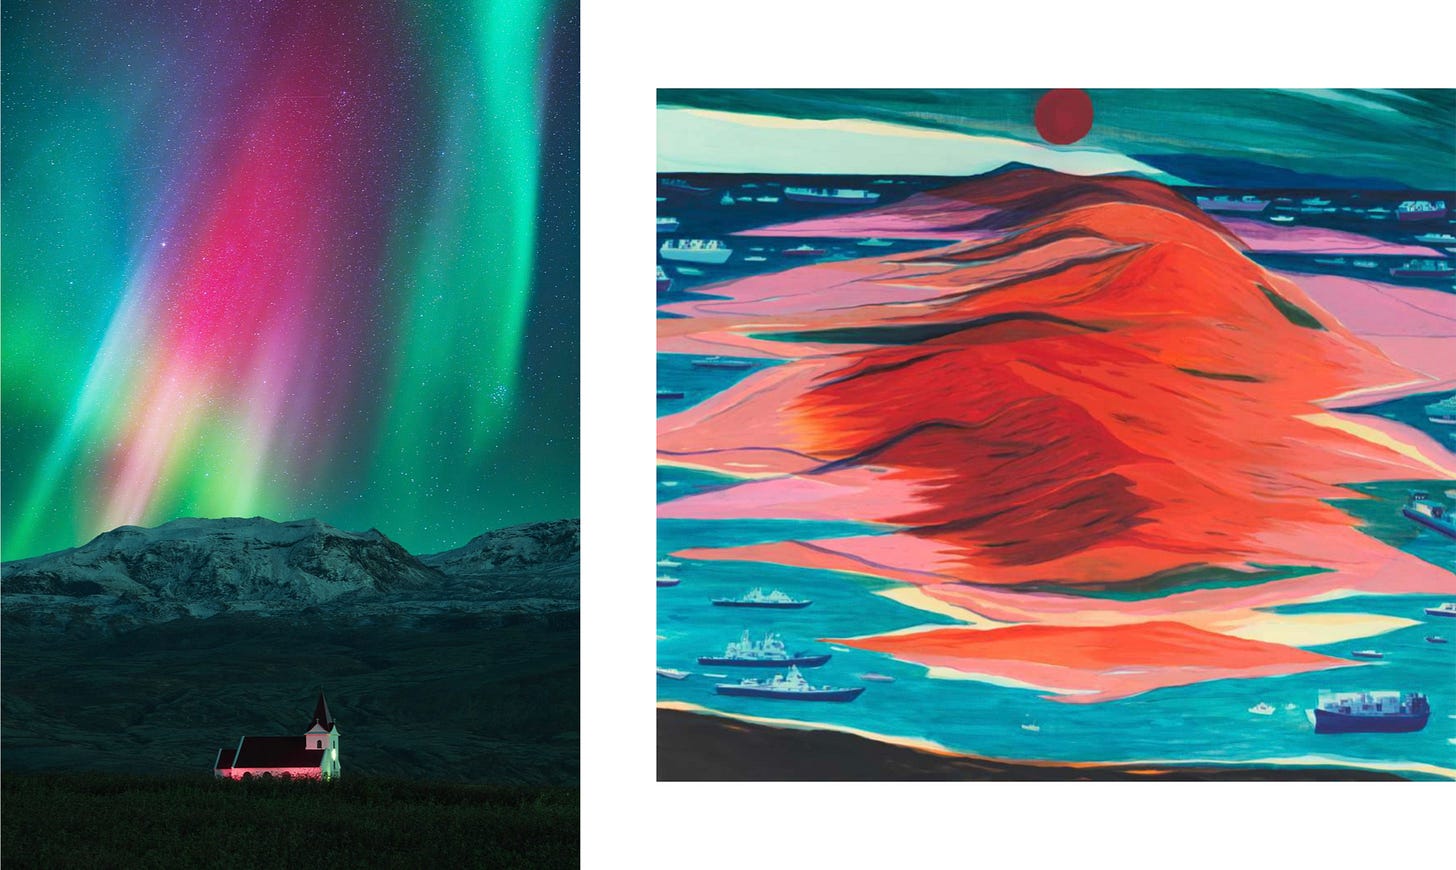
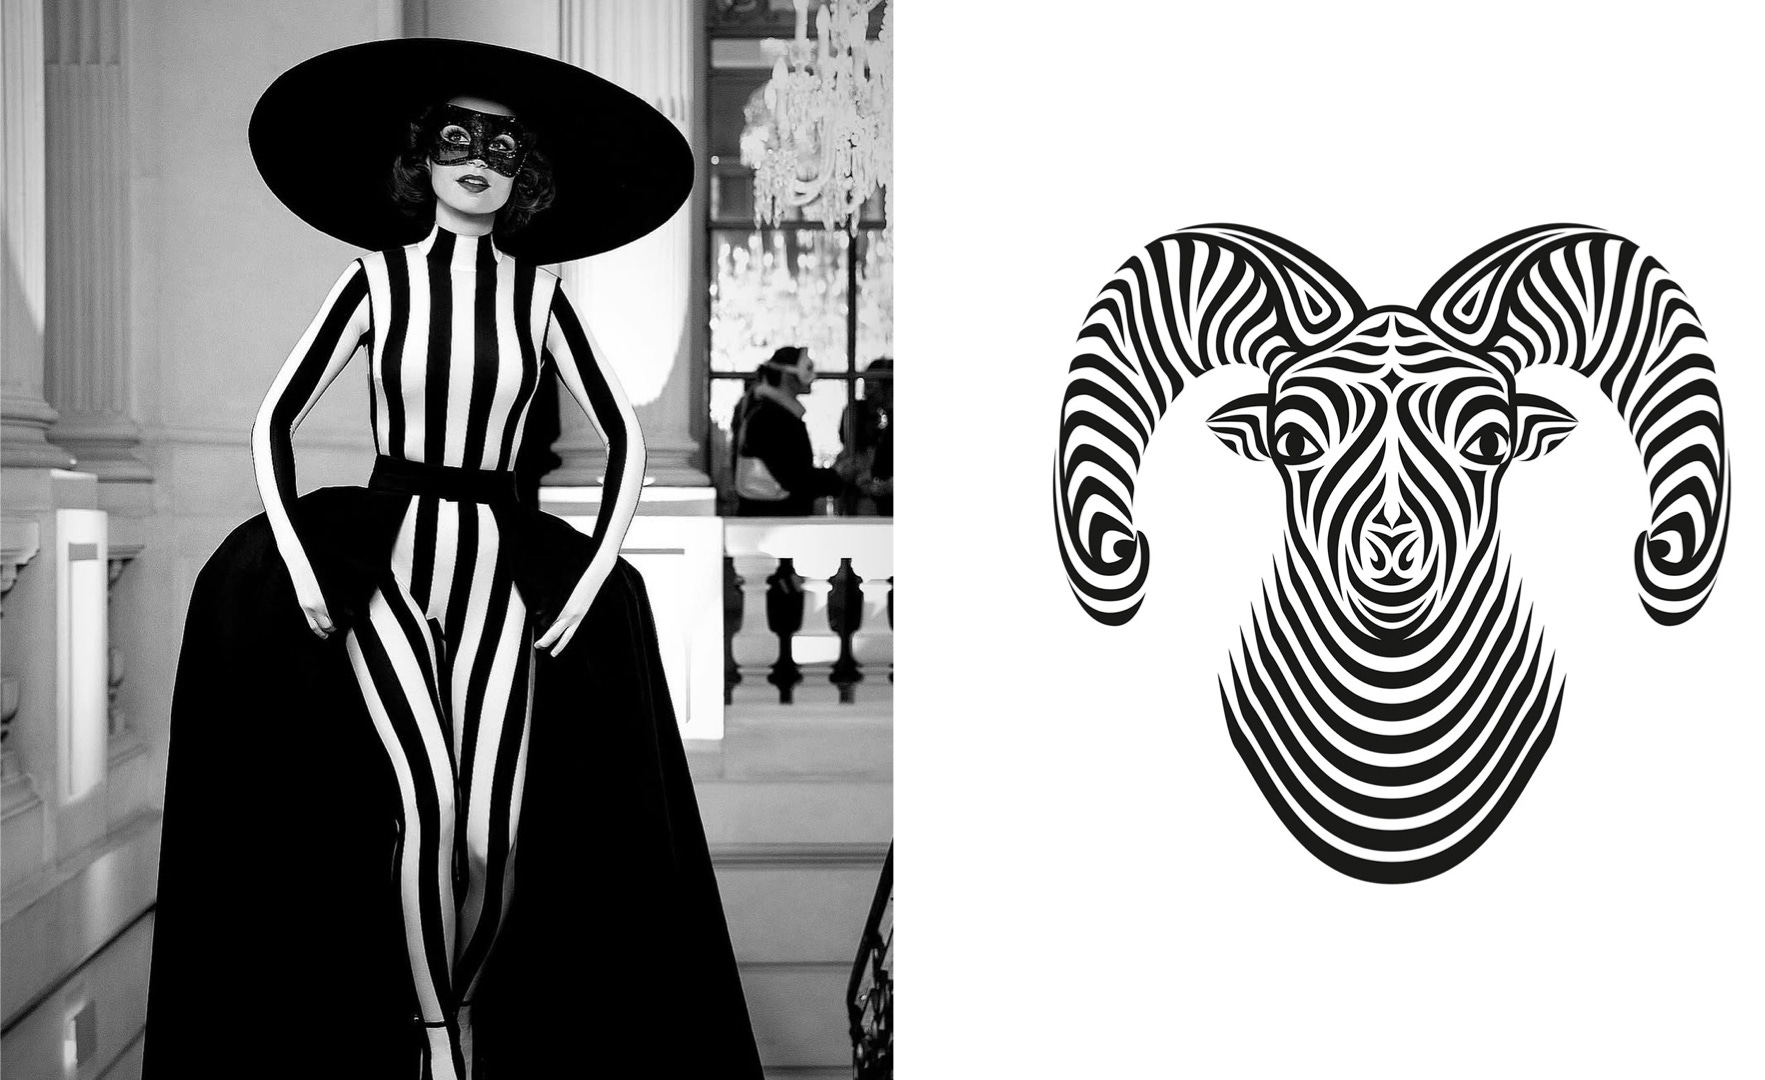
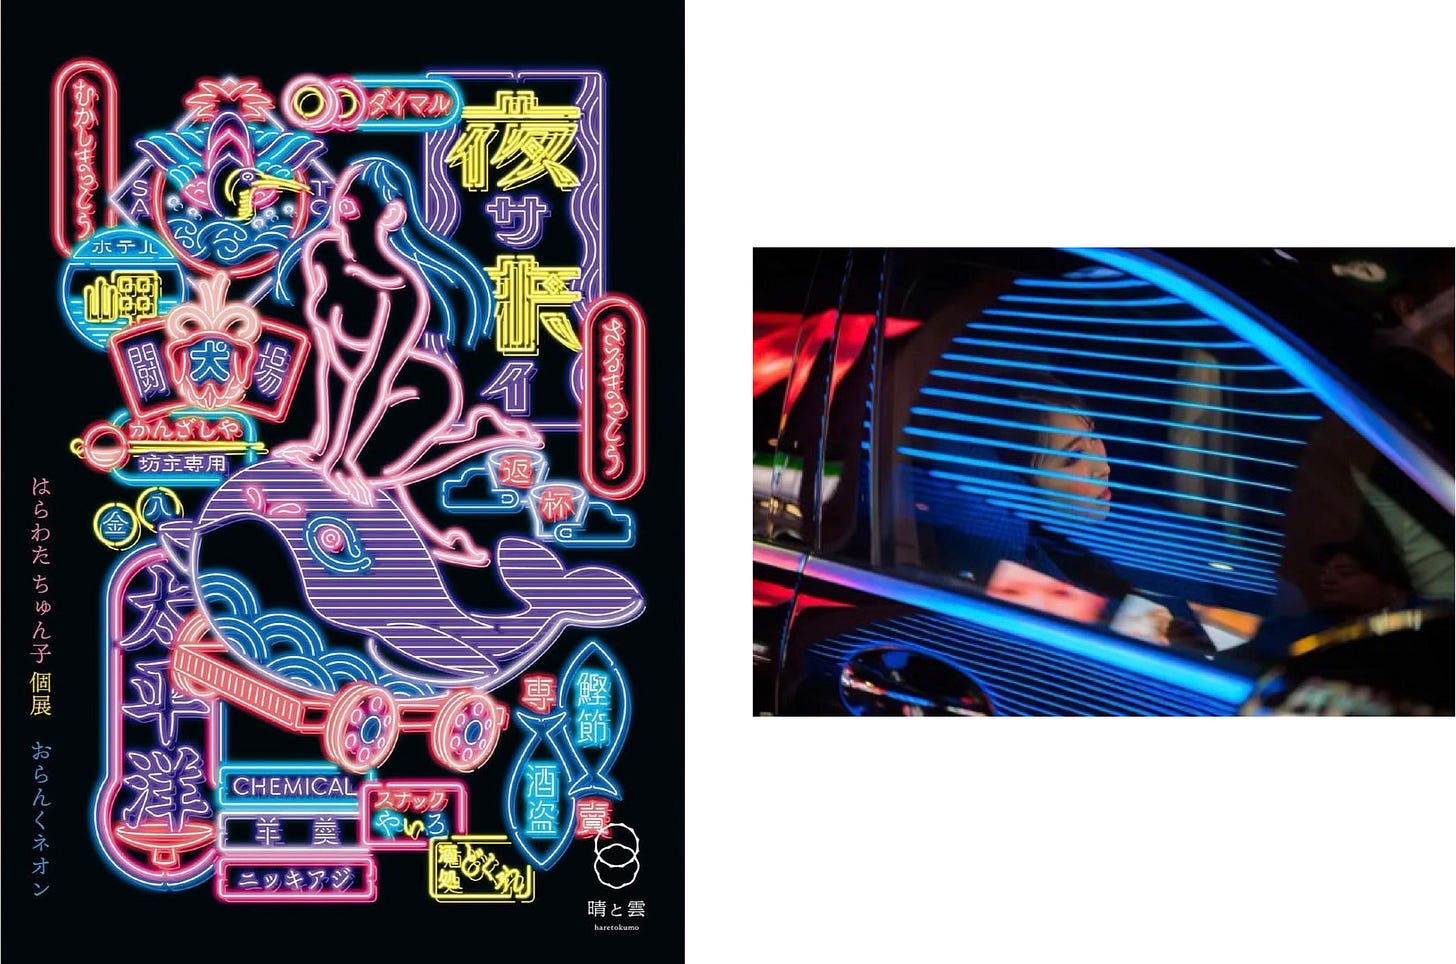
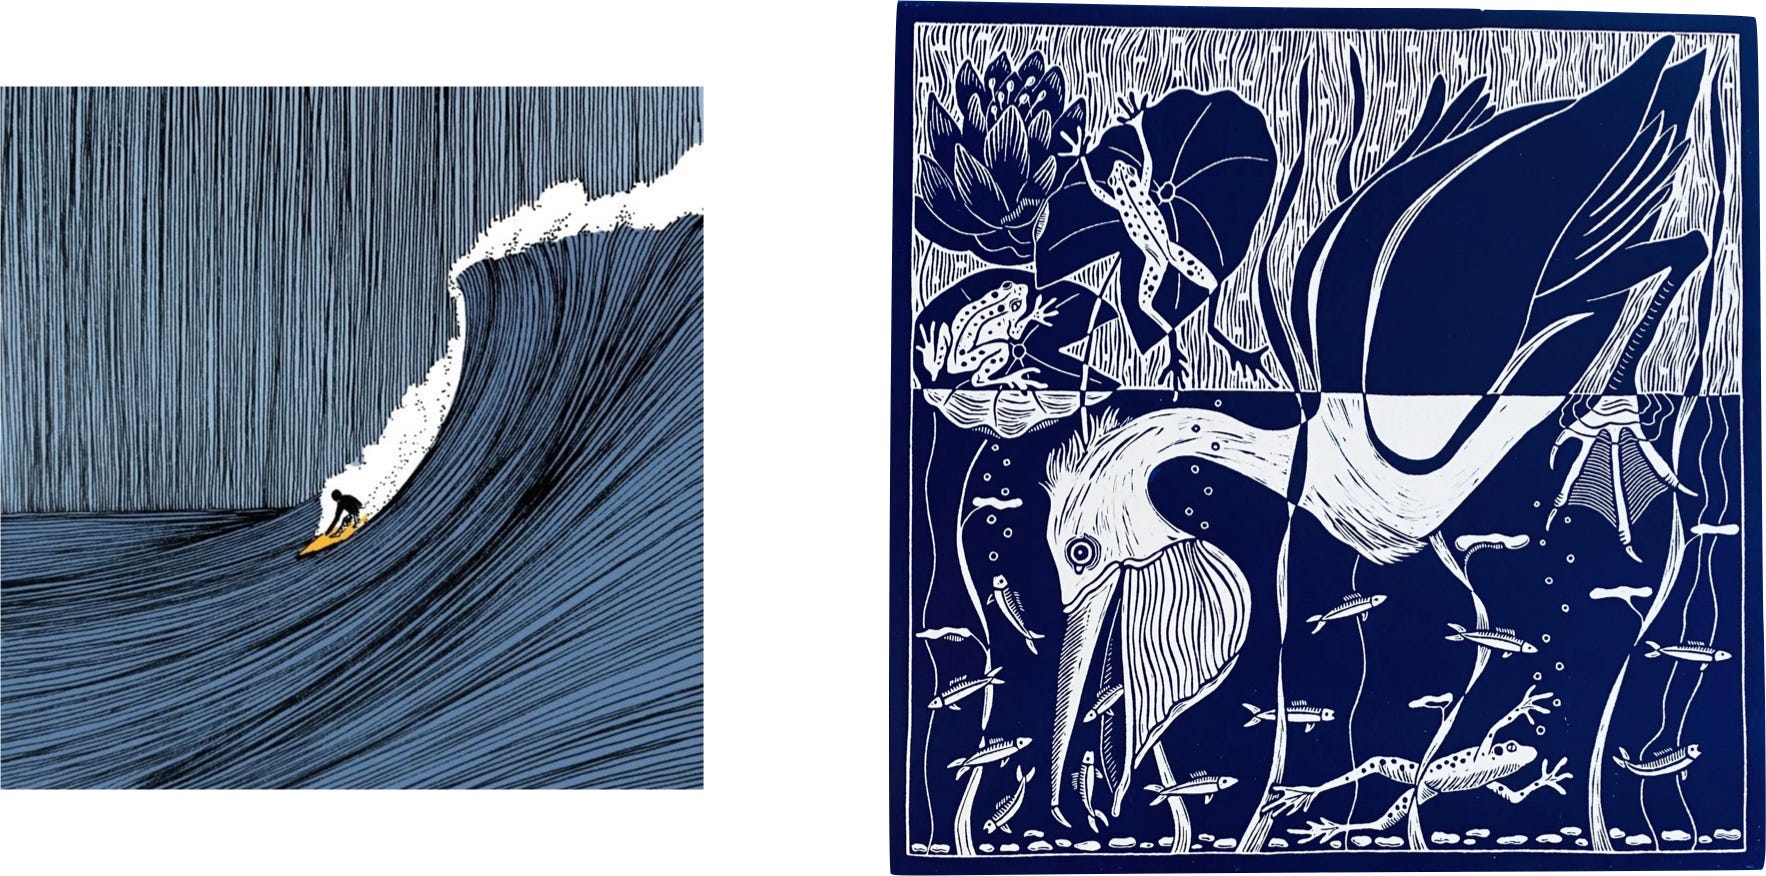
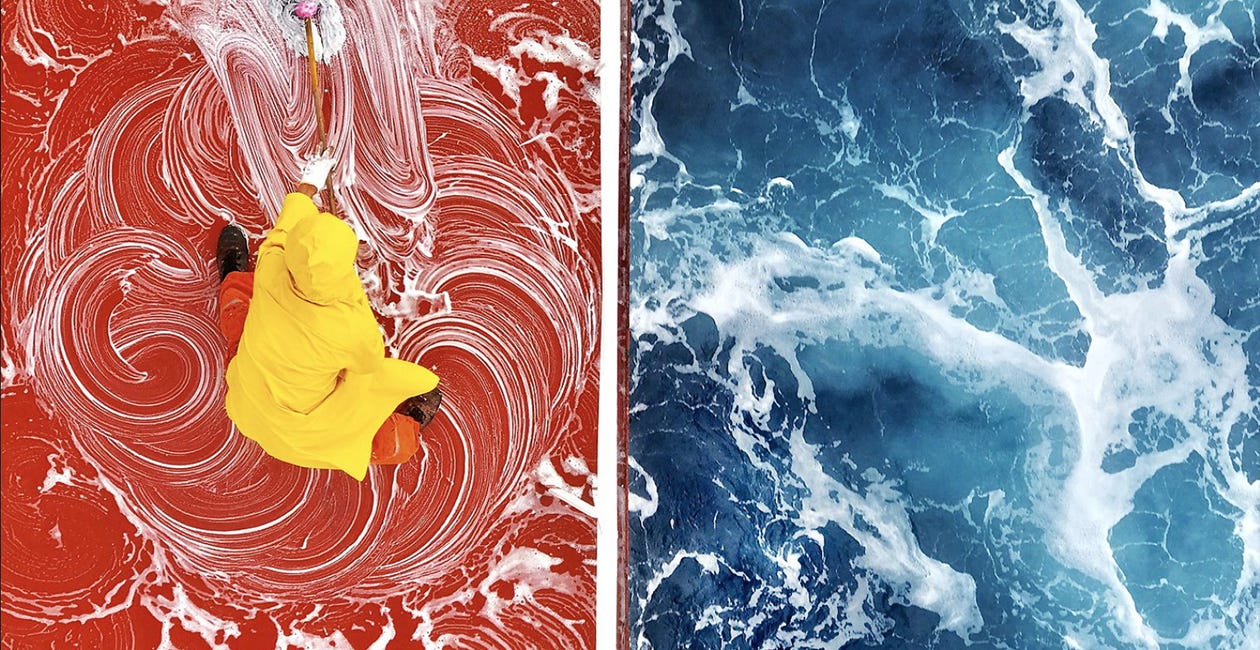
“We can see more when we look across and between designs.” Today, the popular double-shot format returns after a year+ hibernation.
Consider this a palette cleanser before Chartography begins its summer festival, THE SUMMER OF CLARITY. Until then, enjoy today’s inspiration.—RJ
Check out the previous double-shots:
Another Double-Shot of Inspiration
In this edition of Chartography: a parade of dazzling delights Let’s go!
A Double-Shot of Inspiration
In this edition of Chartography: a pairwise tour of inspiring sundries.
About
RJ Andrews helps organizations solve high-stakes problems by using visual metaphors and information graphics: charts, diagrams, and maps. His passion is studying the history of information graphics to discover design insights. See more at infoWeTrust.com.
RJ’s book, Info We Trust, is currently out now! He also published Information Graphic Visionaries, a book series celebrating three spectacular data visualization creators in 2022 with new writing, complete visual catalogs, and discoveries never seen by the public.


