
Ascending into the Realm of Japanese Charts
A prewar collection crosses the Pacific.

Welcome to Chartography—insights and delights from the world of data storytelling.
Rare-book collecting has a new luxury: you can inspect a century-old atlas online before deciding whether to own it.
I was staring at a Kosho listing for a 1925 volume called 模範統計図集 [Model Statistical Illustration Collection]. Kosho is Japan’s immense online antiquarian marketplace. It is not one shop but a network: many dealers, many standards, one sprawling catalog. The depth is astonishing. The presentation can be maddening.
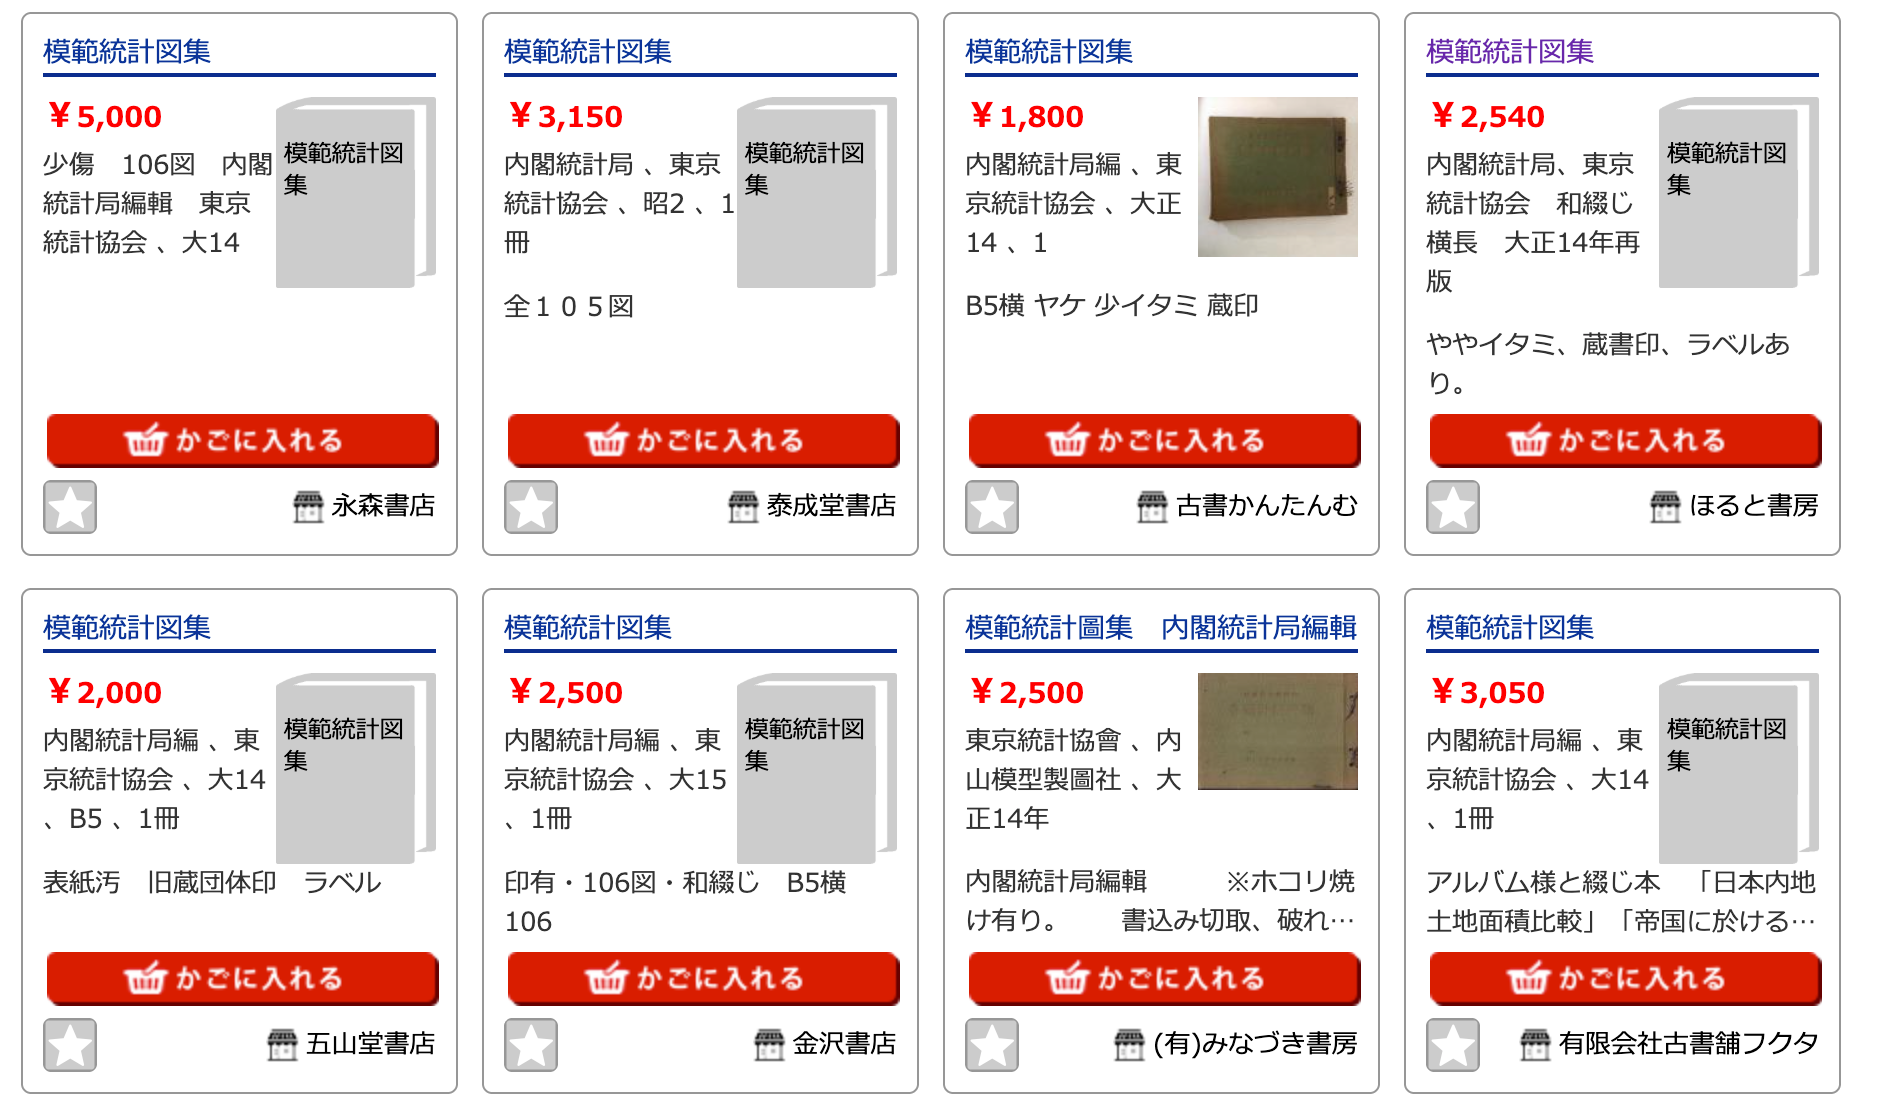
Many listings have little or no imagery. Product metadata is often just enough to lure you in and leave you guessing.
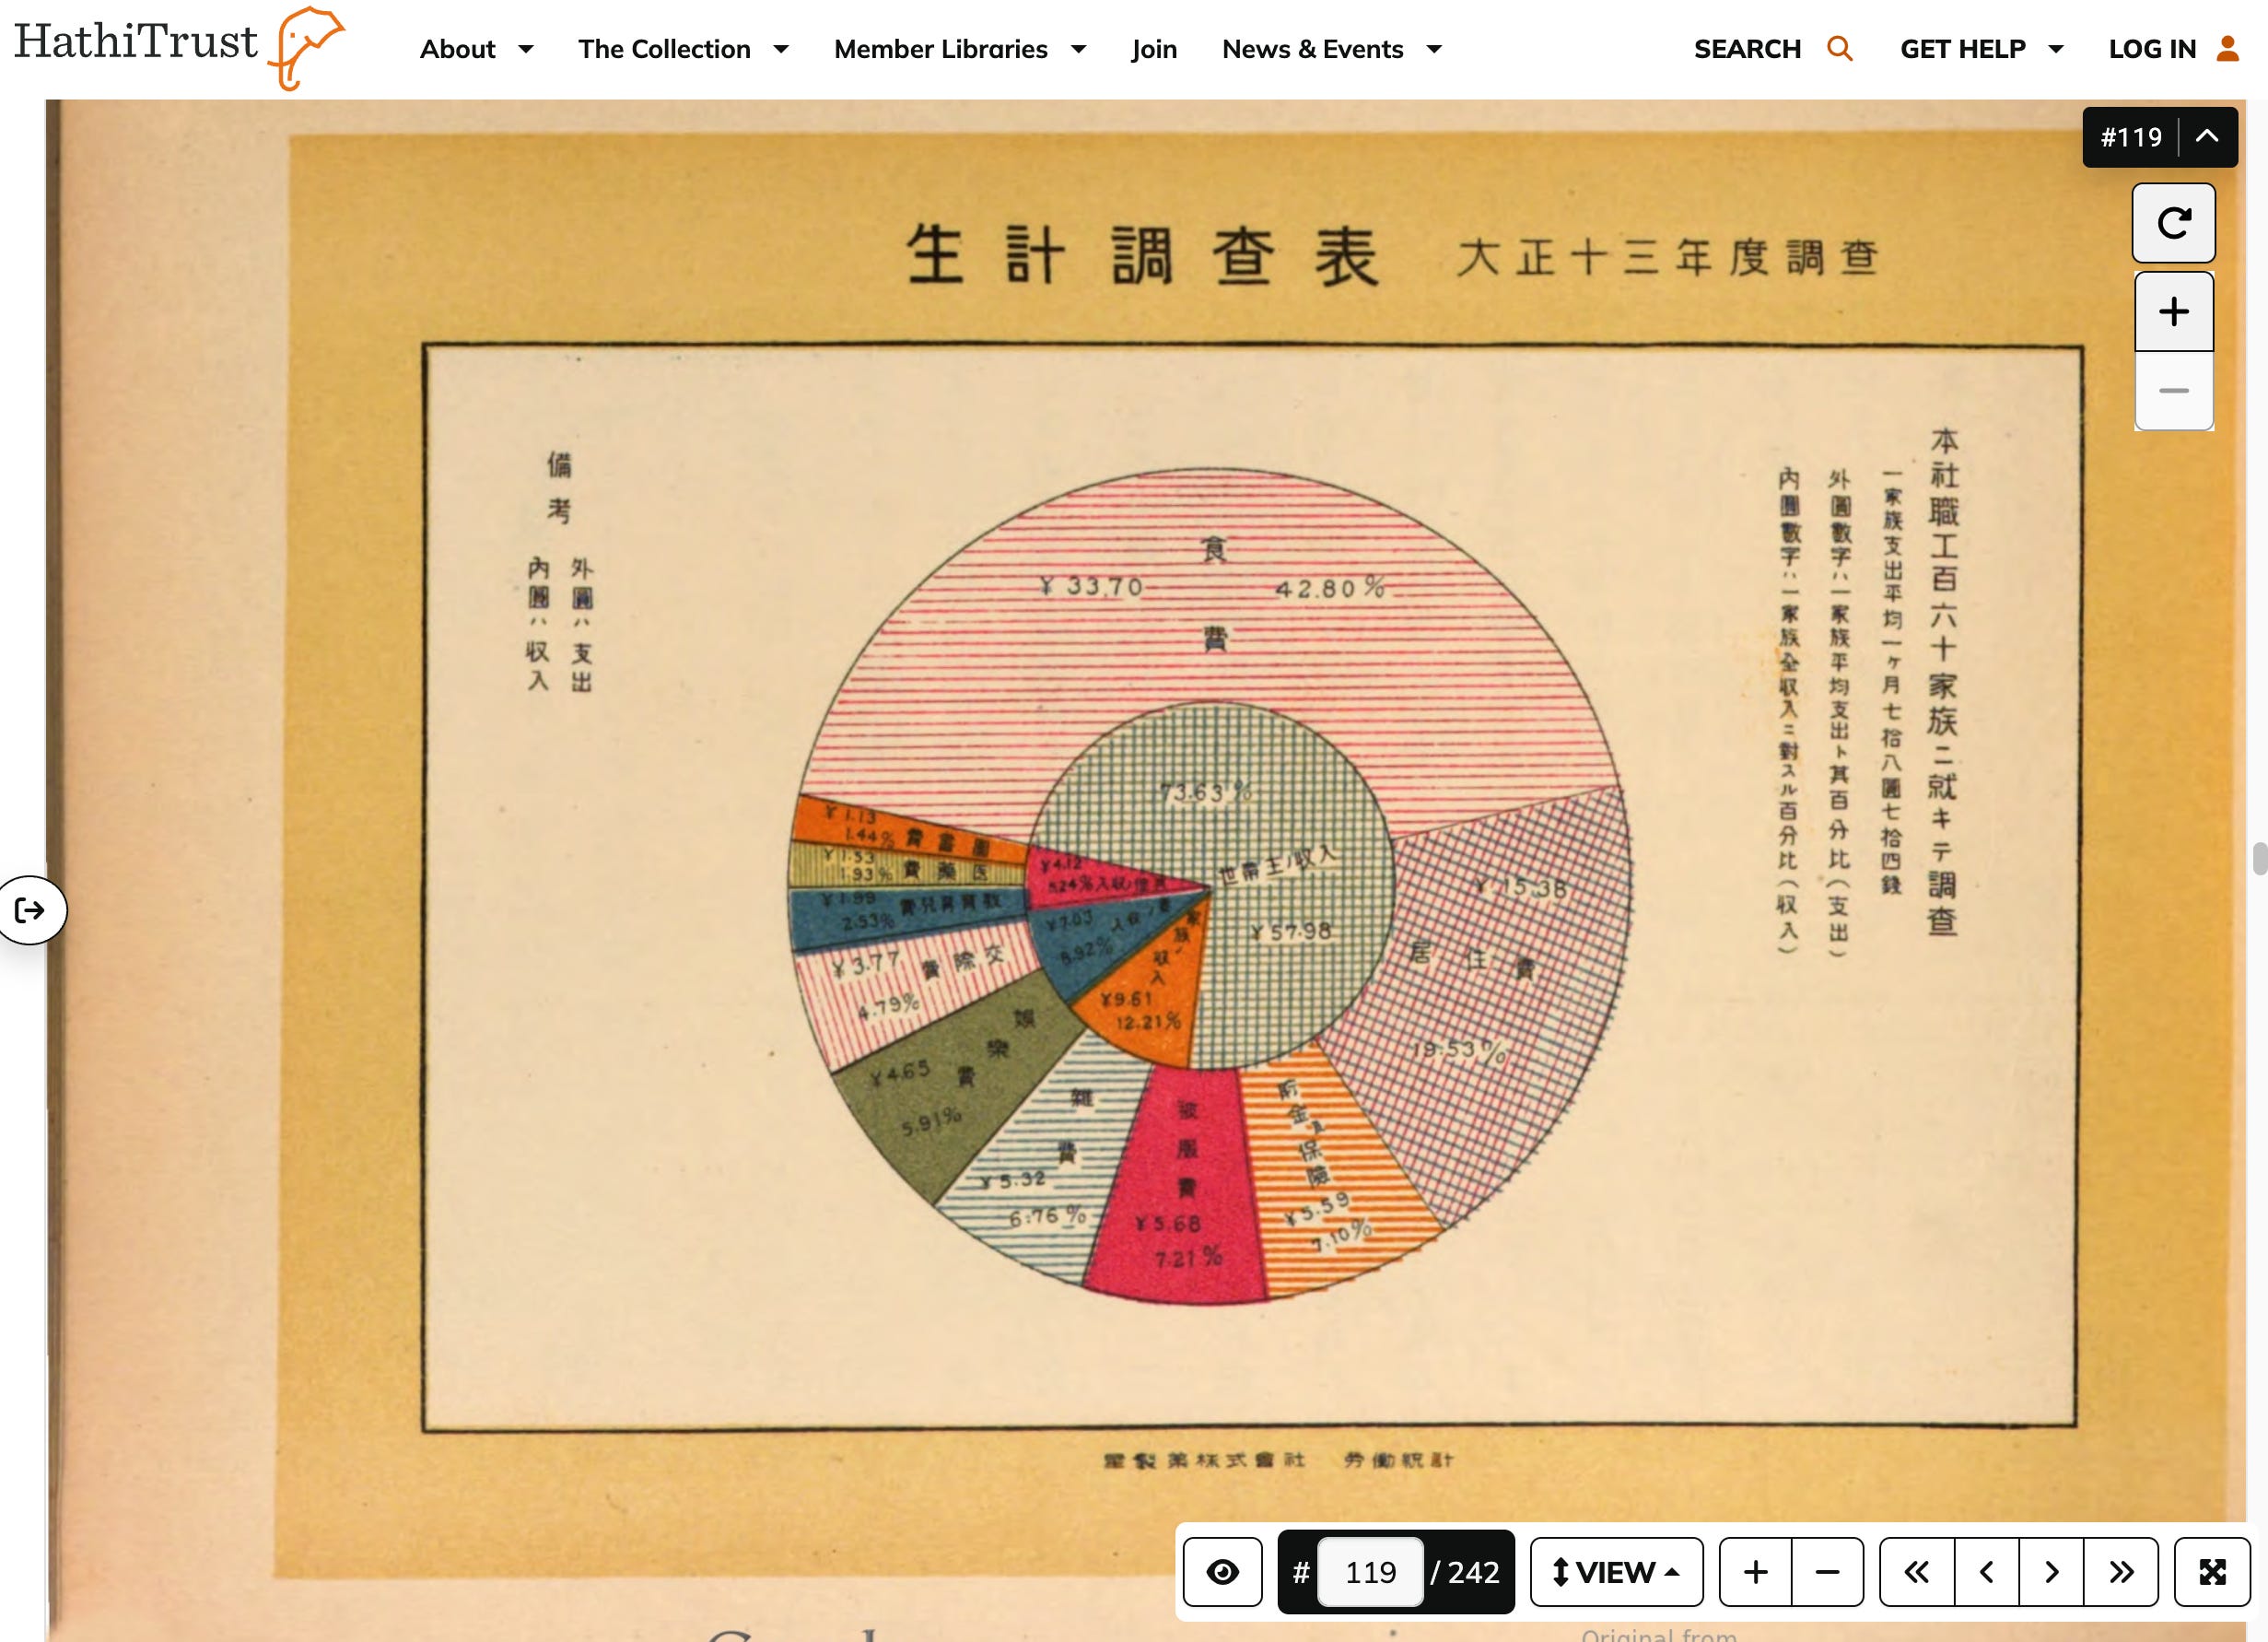
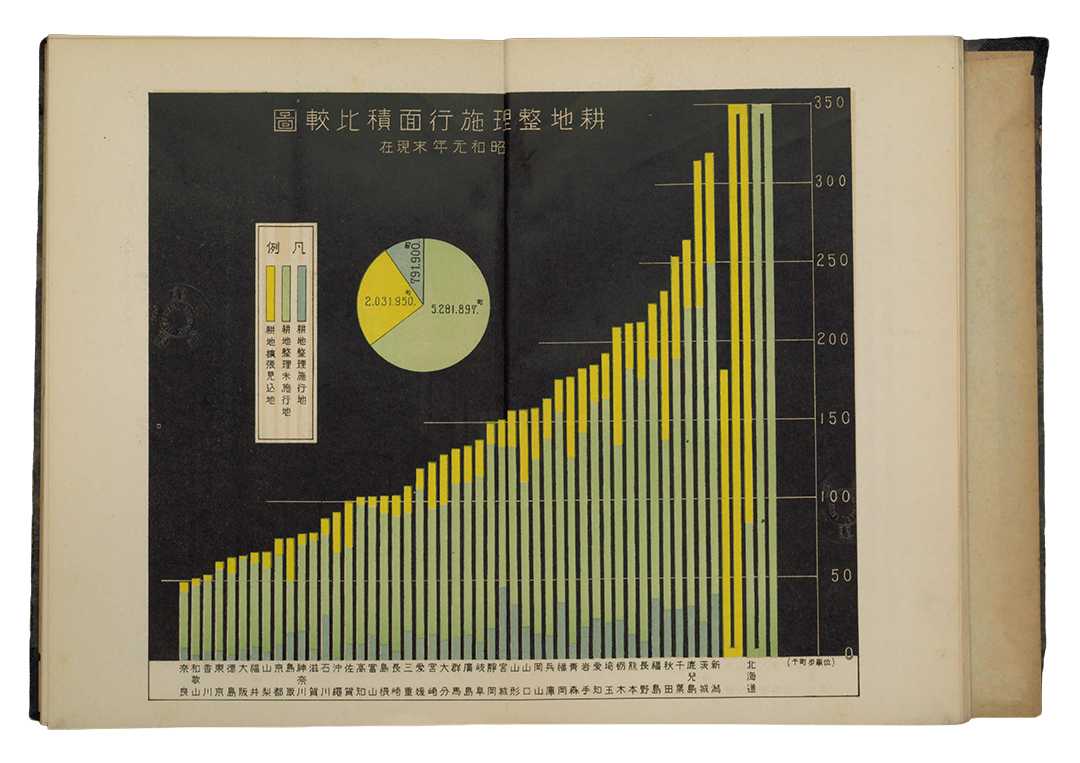
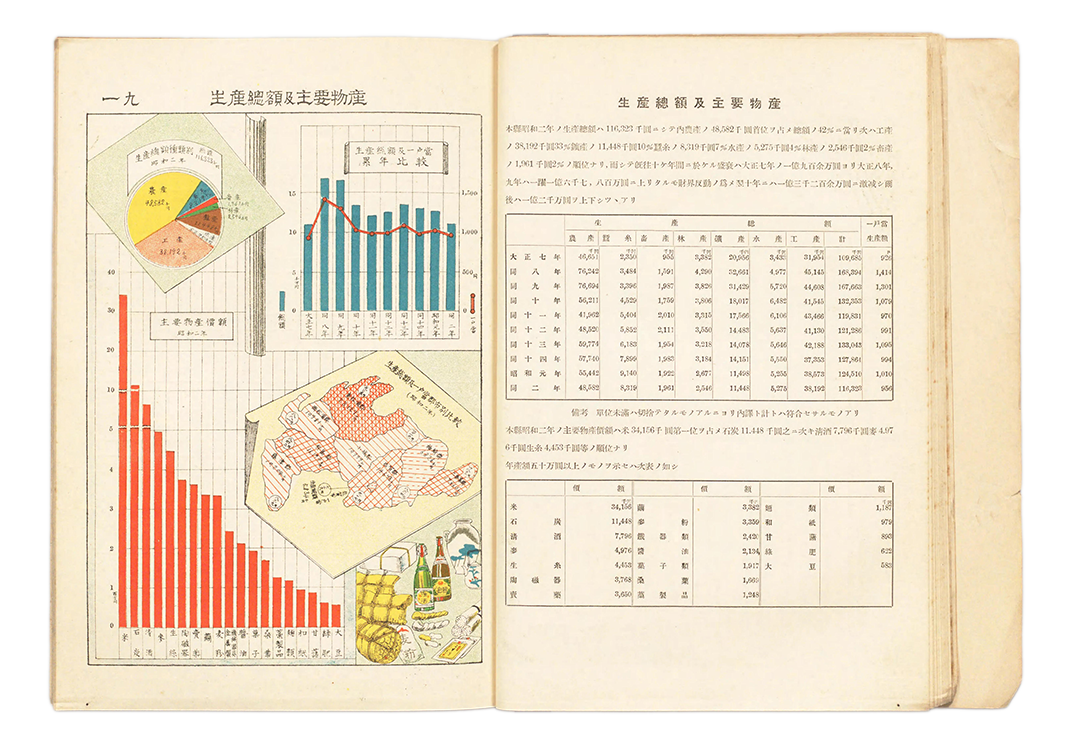
To me, a cryptic listing does not feel like a description. It feels like a challenge. OpenAI helped me translate, disambiguate listings, and locate a digitized copy in HathiTrust. The book has dozens of colorful charts, like this one:
The order of operations has flipped: I no longer have to buy first and inspect later.
That should have simplified the hunt. It did the opposite.
I asked AI for more titles like this one, and a door unlocked. Then I asked it for better search terms. 統計図 [statistical charts, duh] threw that door open wide.
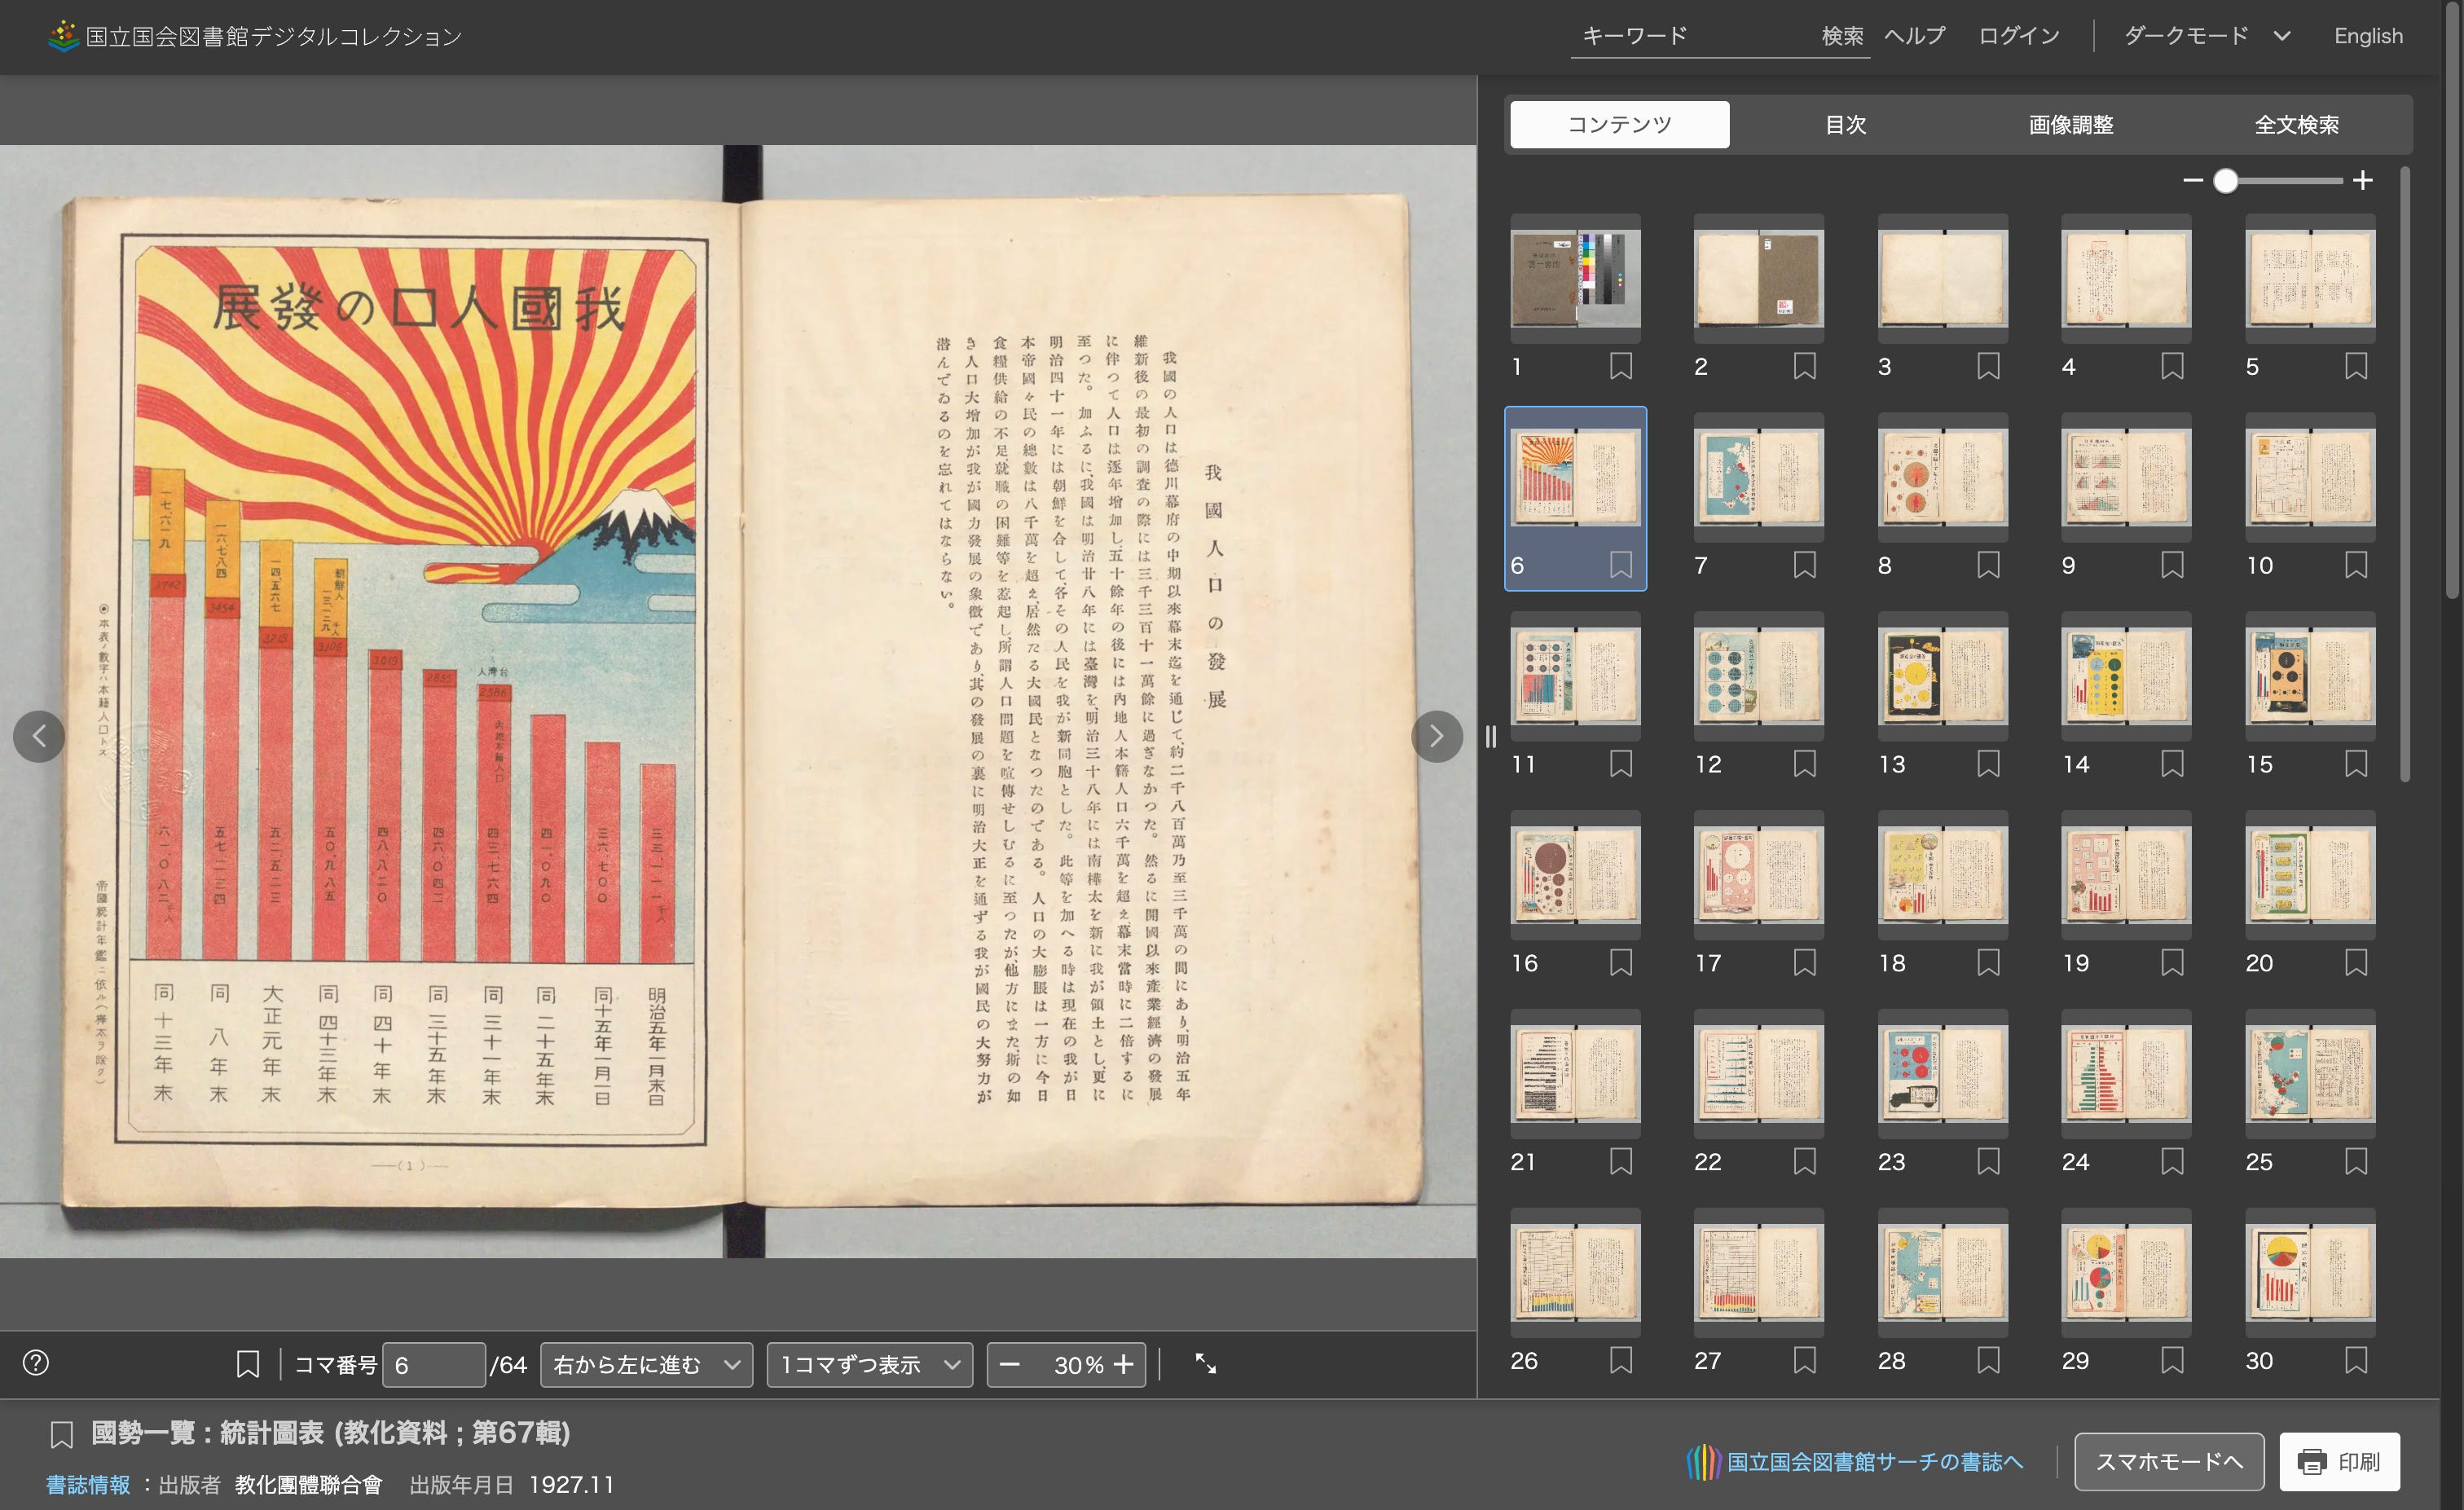
Then AI introduced me to the National Diet Library’s beautiful digitization, which quickly became my prime source for discovery and reference. One chart book became dozens. I inspected over a hundred possibilities. The original listing widened into a network of leads: prefectural atlases, cute municipal chart paperbacks, technical ministry bulletins, and eventually a monumental publication about Japan’s rebuilding after the Great Kantō Earthquake.
At a certain point, I was no longer finding books. I was discovering a world: chart-rich, prewar, often beautiful, and in some cases likely never before shelved in this hemisphere.
Soon it became clear that these were not isolated curiosities. They belonged to a coordinated 1920s campaign to make statistical thinking public.
Here’s what it’s like viewing charts on the National Diet Library’s digital archive. Notice that brilliant chart, and then see how it is one of dozens in the volume.
A digitized library copy could answer whether a work was worth owning. A bookseller’s listing could answer whether a particular copy was worth buying, because condition and price still mattered. AI was most useful in the messy middle: transliteration, bibliography, and navigating market customs during seller communication well enough for me to act. That is a more modest claim than machine genius. It is also the more important one. Rare-book collecting fails when friction wins.
Once I sensed that world—1920s Japanese charts—I wanted a system for judging it. I began sorting discoveries into starred folders based on digitized copies. Four stars meant the full package: mostly graphics, color, and designs that felt strange, special, or sophisticated. Three stars meant serious promise. Lower stars could still contain interesting material, but not enough to make the object irresistible.
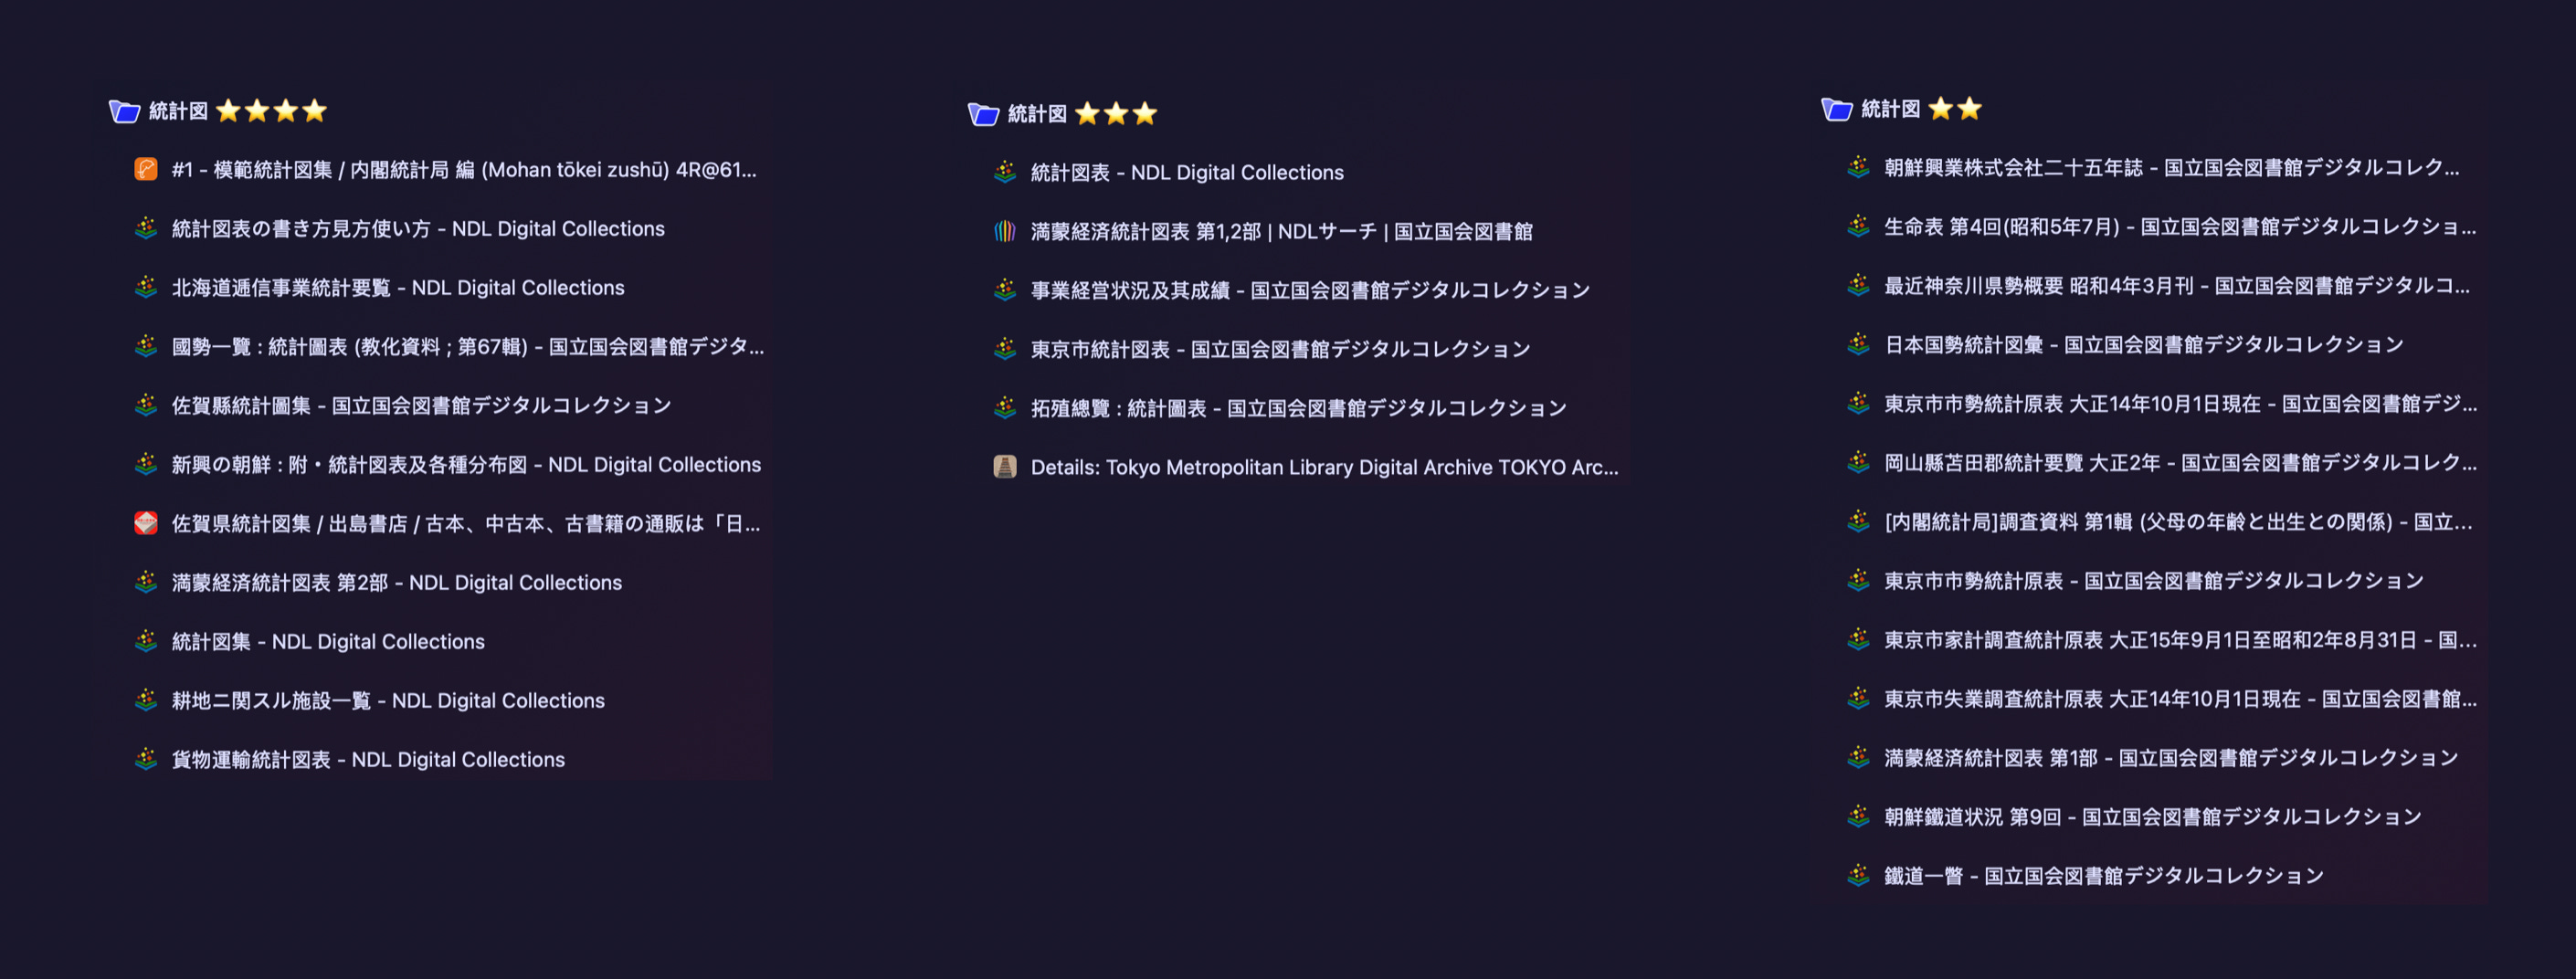
The funnel itself was revealing. Of the pre-1930 titles I surfaced in the National Diet Library, only about half had digitized scans. Of those, maybe one in five looked genuinely worth pursuing. Of those, only about half seemed to have a promising lead on Kosho. The search felt vast, but it was still incomplete. There is much more out there waiting to be found.
AI did not bring taste to the table. It brought traction. I was still the one deciding which artifacts had heat. The machine helped me sort titles, old and modern script variants, seller shorthand, publication dating, and edition confusions that usually slow collecting to a crawl. But I still had to look and decide whether the thing was alive.
That work of judgment is the old task, and the permanent one. The interesting story here is not that AI helped me buy some books. The interesting story is that it helped me scale my judgment. A digitized version could tell me about the work. The seller could tell me about the copy. The machine could help me get from uncertainty to intelligible options. But the wanting still had to come from me. Good collecting begins with taste: knowing when a book is actually worth chasing.
Soon the books themselves began to make an argument. Chasing the Model Statistical Illustration Collection led me to the 1925 Cabinet Statistical Exhibition in Tokyo, and that changed the meaning of the book completely. This was not just another old volume of charts. It was the printed afterlife of a three-day public exhibition mounted to spread statistical thinking, publicize that year’s simplified census and unemployment survey, and promote thrift, efficiency, and improved daily life. The exhibition reportedly gathered hundreds of charts, books, posters, and other items from government offices, schools, private companies, and newspapers.
Several forces were converging at once: census bureaucracy gave these charts data; industrialization and labor unrest gave them social problems to visualize; the Great Kantō Earthquake gave them urgency; mass politics and mass media gave them audiences; efficiency discourse gave them a moral vocabulary; empire and cartography gave them spatial techniques; and Japan’s already sophisticated print and graphic culture gave them a broader visual ecosystem..
From there, the chase ran outward into late-1920s serial chart publications, technical ministry work, prefectural atlases, and commemorative volumes. What began as a shopping problem turned into a fabulous parade. These books suggest a moment when charts in Japan stopped being occasional illustrations and started becoming part of the regular equipment of administration. Charts did not suddenly appear in Japan in the 1920s. But somewhere in the years after the Great Kantō Earthquake, when modern industrialization exploded, they began to harden into one of the state’s routine instruments for seeing, persuading, and governing.
The logistics mattered too. This was not one miraculous purchase. It was eight separate orders placed to Japanese dealers through Kosho, totaling 19 volumes.
The dealers did not ship directly to me in the United States. They shipped to a middleman forwarding service in Japan, which consolidated the books into a single box and sent that box onward across the Pacific. It was not elegant. It was slow. The fees were annoying. I even got hit with tariffs along the way, which books are not supposed to attract. But the important point is this: the apparatus worked. Books that would otherwise have remained tantalizingly out of reach, for a century, crossed the ocean.
Scale changed the feeling of the project. One purchase can still be a curiosity. Nineteen volumes start to constitute evidence. By the time the forwarding service had done its work and the consolidated shipment reached me in the United States, this no longer felt like I had found a few exotic books. It felt like I had pulled a whole tributary of graphic history into view.
After unboxing, the books covered my studio table.
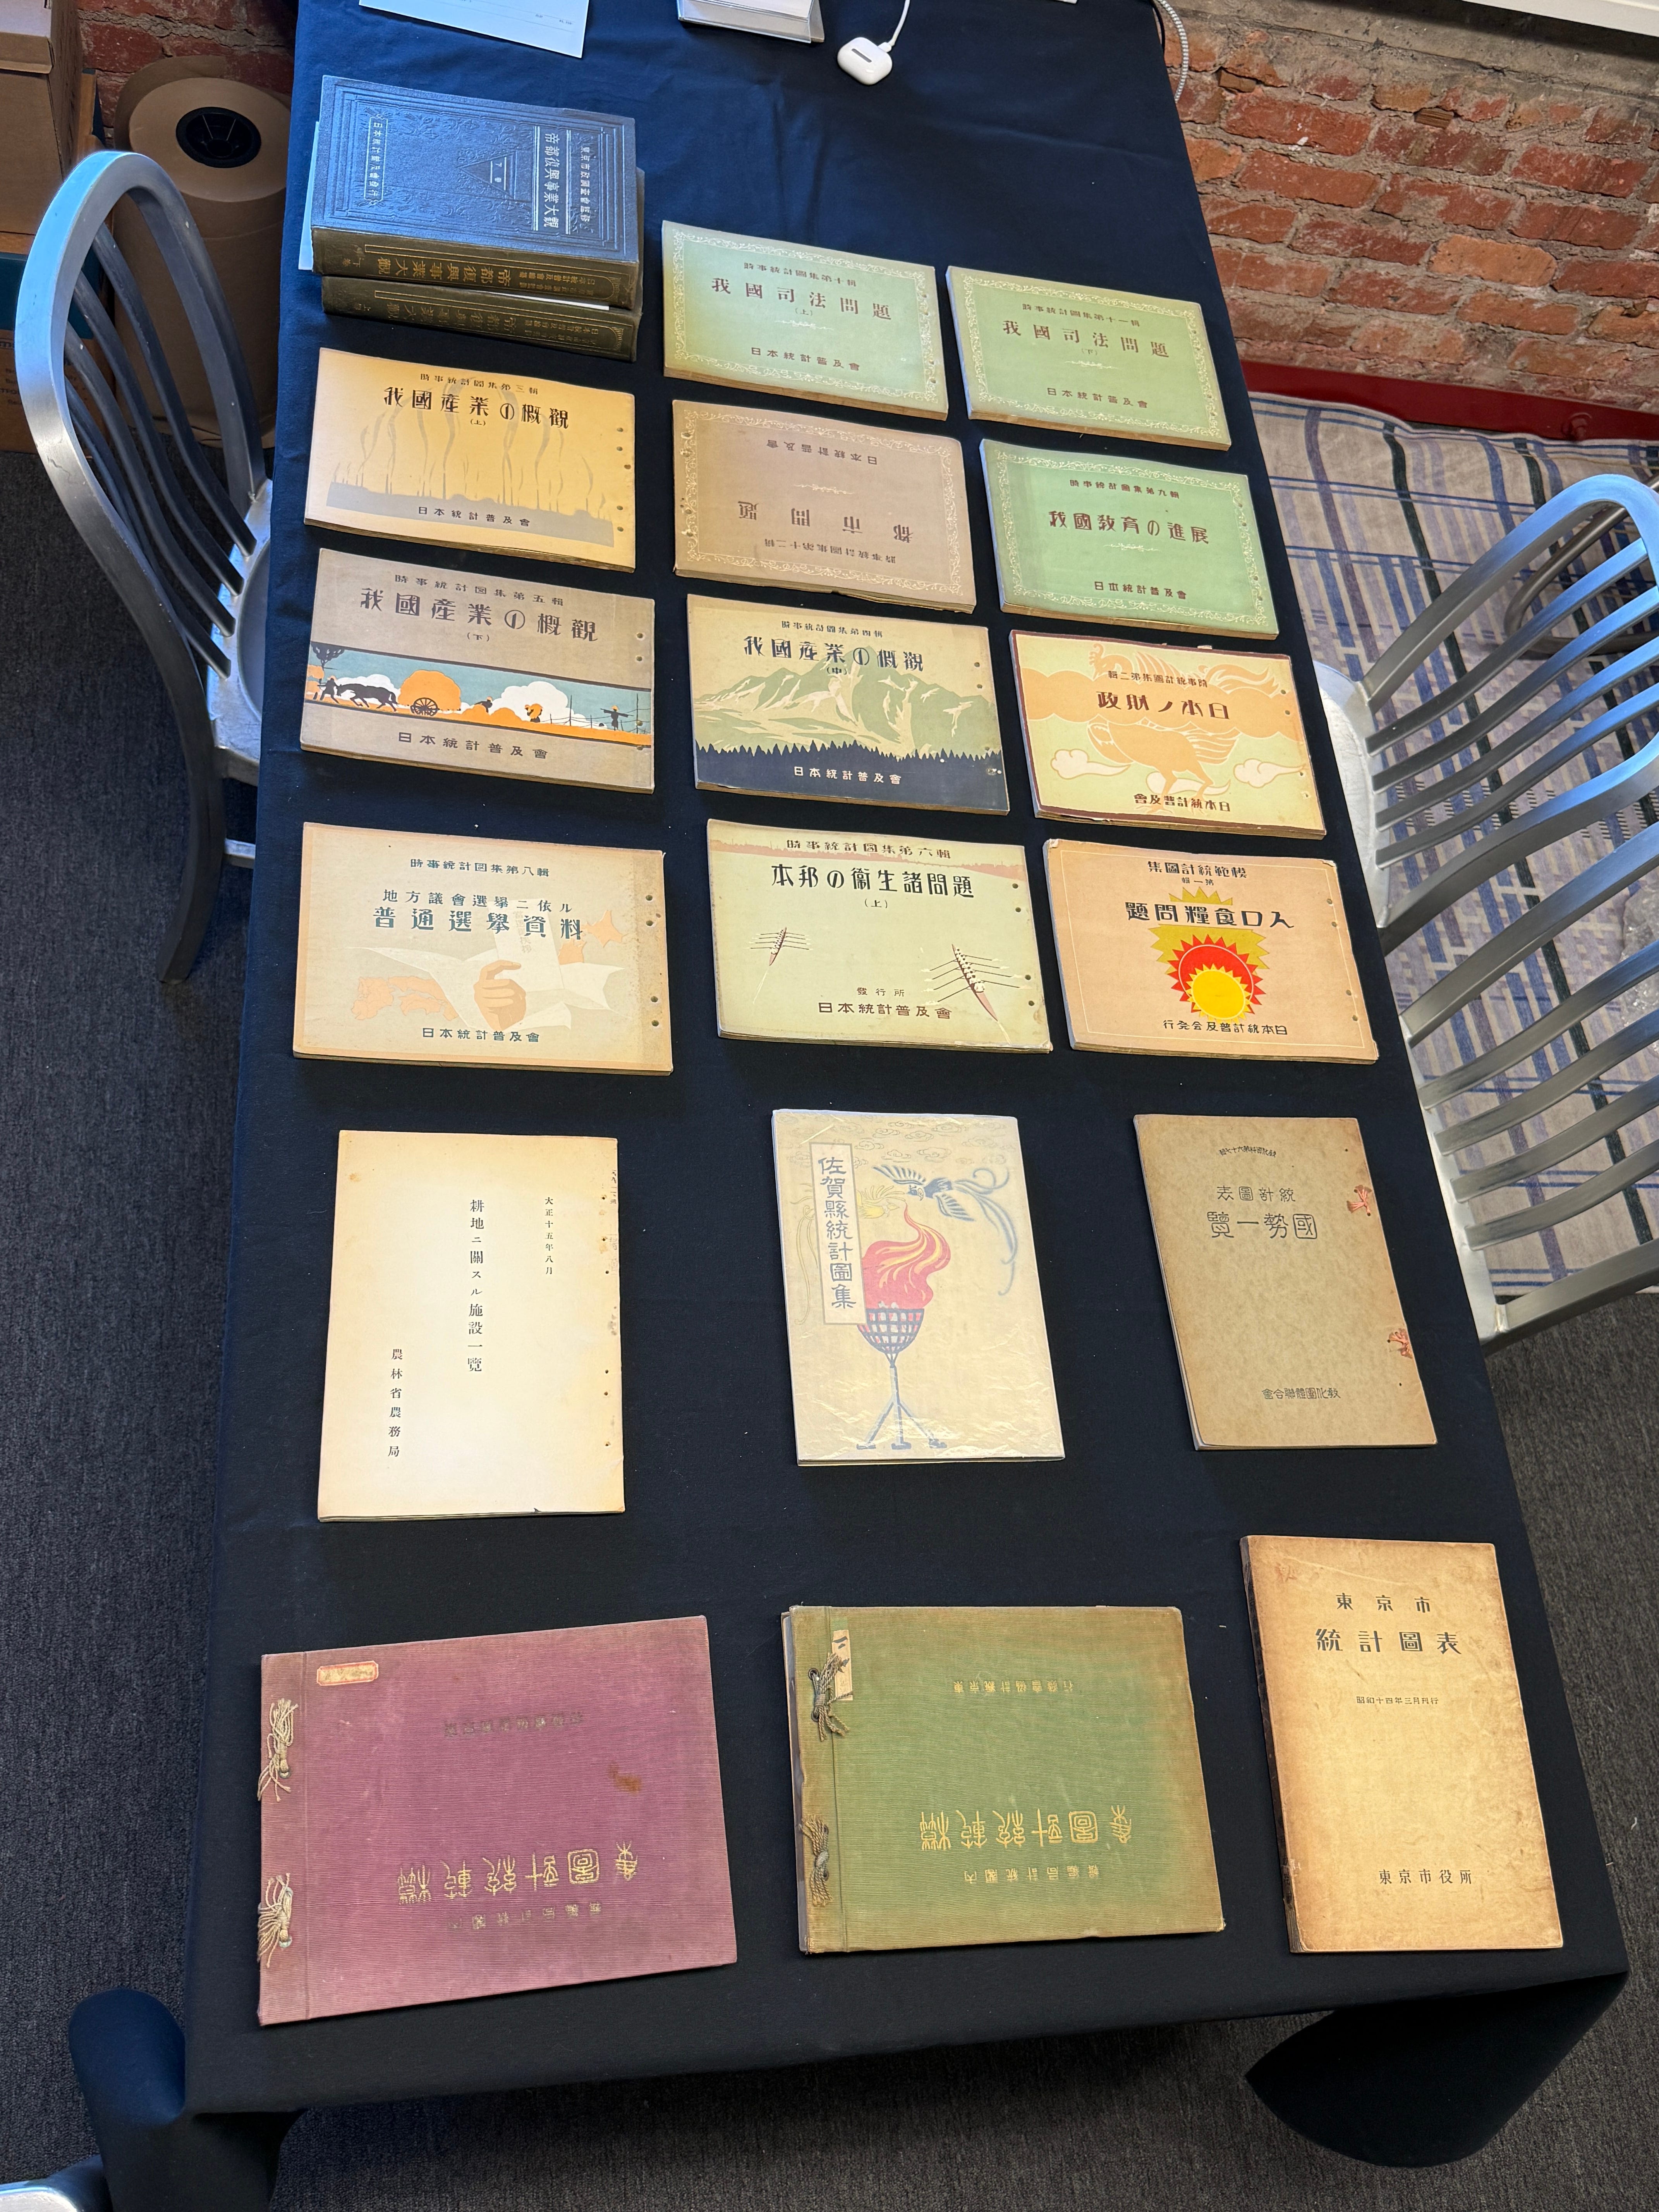
The near-complete run of the Current Affairs Statistical Atlas, at the top of the table, deserves special mention, because it changed the hunt from selective acquisition to something more archival. At first the set looked risky. The set was incomplete by one volume. The total price was not trivial. The sheer quantity threatened to turn desire into burden. But once I inspected the digitized versions, the logic changed. The chart density was real. The creativity was real. The purchase no longer felt like a burden. It felt like an extraordinary opportunity.
That is where the essay stops being only about Japan. My collecting thesis has been expansionary and optimistic for years: There are many more great historic graphics in the world than current conversations admit. These graphics are missing from books, lectures, collections, presentations, and popular histories not because they are necessarily minor, but because archives are deep, digitization is partial, and habits of attention are narrow. A huge amount of the contemporary graphic-history conversation has been shaped by Western researchers, Western institutions, Western archive access, and Western language comfort. That does not make the resulting canon false. It does make it partial.
And the biggest gap I feel between popular Western acknowledgement and the surviving record may be in Asia. That is not an attempt to flatten all histories into one or deny the foundational importance of early modern and industrial developments in Europe and North America. Plenty of the great breakthroughs really did happen there. But it is one thing to say that. It is another to imagine that the current map of recognized masterpieces is complete. It is not.
Language barriers, cultural distance, uneven digitization, weak collaboration across archives, and long habits of Western indifference have all helped keep Asian material less visible than it should be. I am not a Japan scholar. My edge here is is appetite, pattern-recognition, and nearly a decade of collecting. I spent 2008 in Beijing as a science diplomat for the U.S. National Science Foundation. I have also lived in San Francisco amid Asian-American communities long enough to understand how provincial American attention can remain while still imagining itself worldly. That background does not make me an expert. It does make me less willing to confuse familiarity with importance.
That skepticism has paid. Again and again I have found works that the present has not yet fully learned how to value. Sometimes the market does not know what it is holding. Sometimes the archive is too deep. Sometimes the metadata is too weak. Sometimes the language barrier is enough to keep a whole class of artifacts outside ordinary recognition. But the work survives anyway. That is the optimistic part. The world is still full of precious things that have not yet been properly acknowledged as such.
That optimism is not abstract for me. It is sitting here in my studio library. These books are reminders that historical importance and present recognition do not move in lockstep. A work can be visually ambitious, historically revealing, and still remain only dimly visible to the people who would care most about it. That lag between value and acknowledgement is a collector’s edge.
That is the feeling I have now, surrounded by these Japanese statistical books. Not completion. Not triumph. Something more unstable and more exciting: possibility. The near-complete run of Current Affairs Statistical Atlas alone could keep me busy for months. And the larger payoff still astonishes me. After tracing the growth of Japanese statistical graphics through the 1920s, through reconstruction, efficiency, municipal ambition, and bureaucratic self-education, I ended up holding the Comprehensive Overview of the Imperial Capital Reconstruction Project, a 1931 monumental two-volume work on rebuilding Tokyo after the Great Kantō Earthquake of 1923. That’s the same catastrophe that seems to have helped accelerate Japan’s appetite for visual statistical explanation. It’s packed with foldout charts and maps across two handsome volumes.
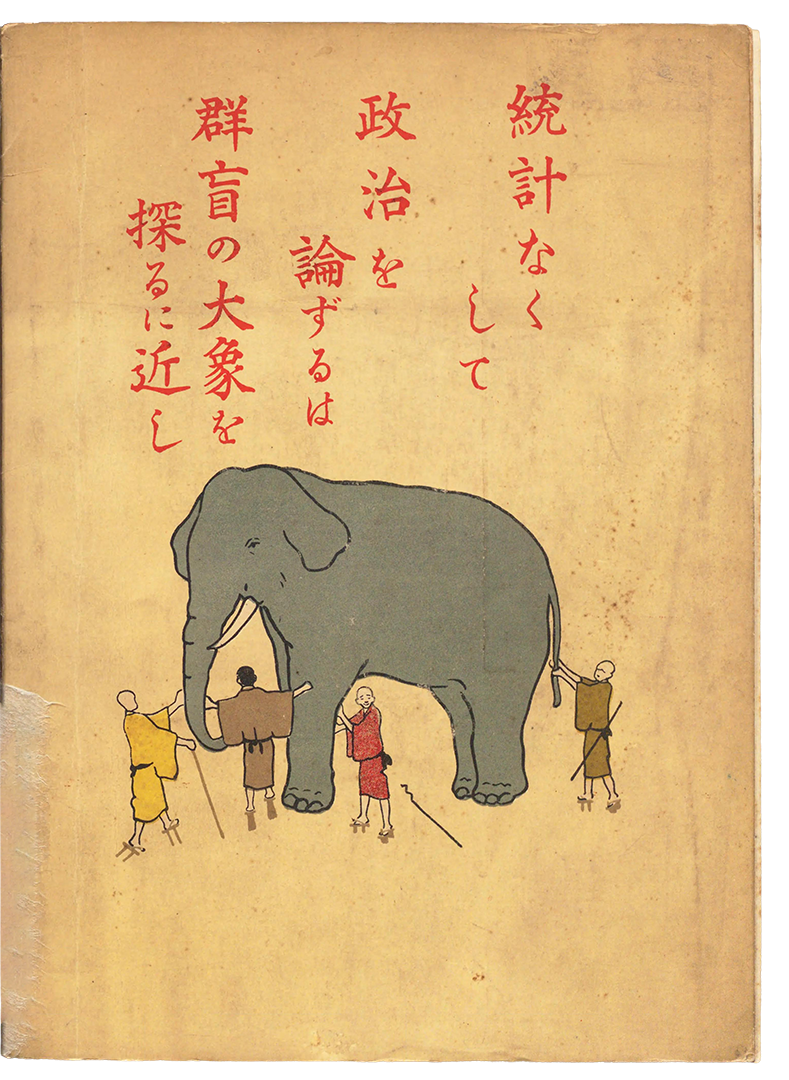
The back cover of Saga Prefecture Statistics Collection from 1929 features the parable of the blind men and an elephant. What a beautiful metaphor for a bunch of charts.
It does not feel like the end of a spree. It feels like the opening of a vault. Every one of these books seems to contain several Chartography essays at once.
And if this much was waiting in one corner of one market, then much more is still out there: shelved, scanned, misdescribed, untranslated, and waiting for someone with enough curiosity and taste to notice.
Onward!—RJ
About
Chartography is the newsletter of Visionary Press and Info We Trust, by RJ Andrews.
RJ Andrews is obsessed with data graphics. He helps organizations solve high-stakes problems by using visual metaphors and information graphics: charts, diagrams, and maps. His passion is studying the history of information graphics to discover design insights. See more at infoWeTrust.com.
RJ’s book, Info We Trust, is out now! He also published Information Graphic Visionaries, a book series celebrating three spectacular creators in 2022 with new writing, complete visual catalogs, and discoveries never seen by the public.
Beautiful, RJ: the books, the graphics, the pursuit, the story.
And as always, the fact that these are visual books makes them all the more alluring in spite of (and because of) my inability to read the words.
These books and the charts they contain trigger my imagination in ways that would never happen were I able to read the Japanese. Which is a slippery slope.
I'm reminded of the many conversations I've been a part of at dining tables around the world where the language being spoken is one I'm only partially familiar with. I become convinced that everyone is talking about bicycles, so I build an entire thought about bicycles, compose my witty bicycle comment, and finally deliver it.
To silence.
They were talking about grandma's long lost cat.