
Ben-Day of Days
RJ's Vulnerable Voyage Part 5

Welcome to Chartography.net — insights and delights from the world of data storytelling.
📖 Surveys to Kickstarter-backers of Info We Trust were sent earlier this week. They collect addresses needed to ship you books. Please complete the survey soon so that there is no delay in delivering your books.
You may still order an “early edition” of Info We Trust directly.
I expect Kickstarter and early editions will ship to readers before the holidays, well in advance of our March 2025 publication.
🗓️ My office hours are filling up every week, so I added slots. You may also now schedule three weeks in advance. Let’s chat data graphics.
Filling MAPS FOR KIDS
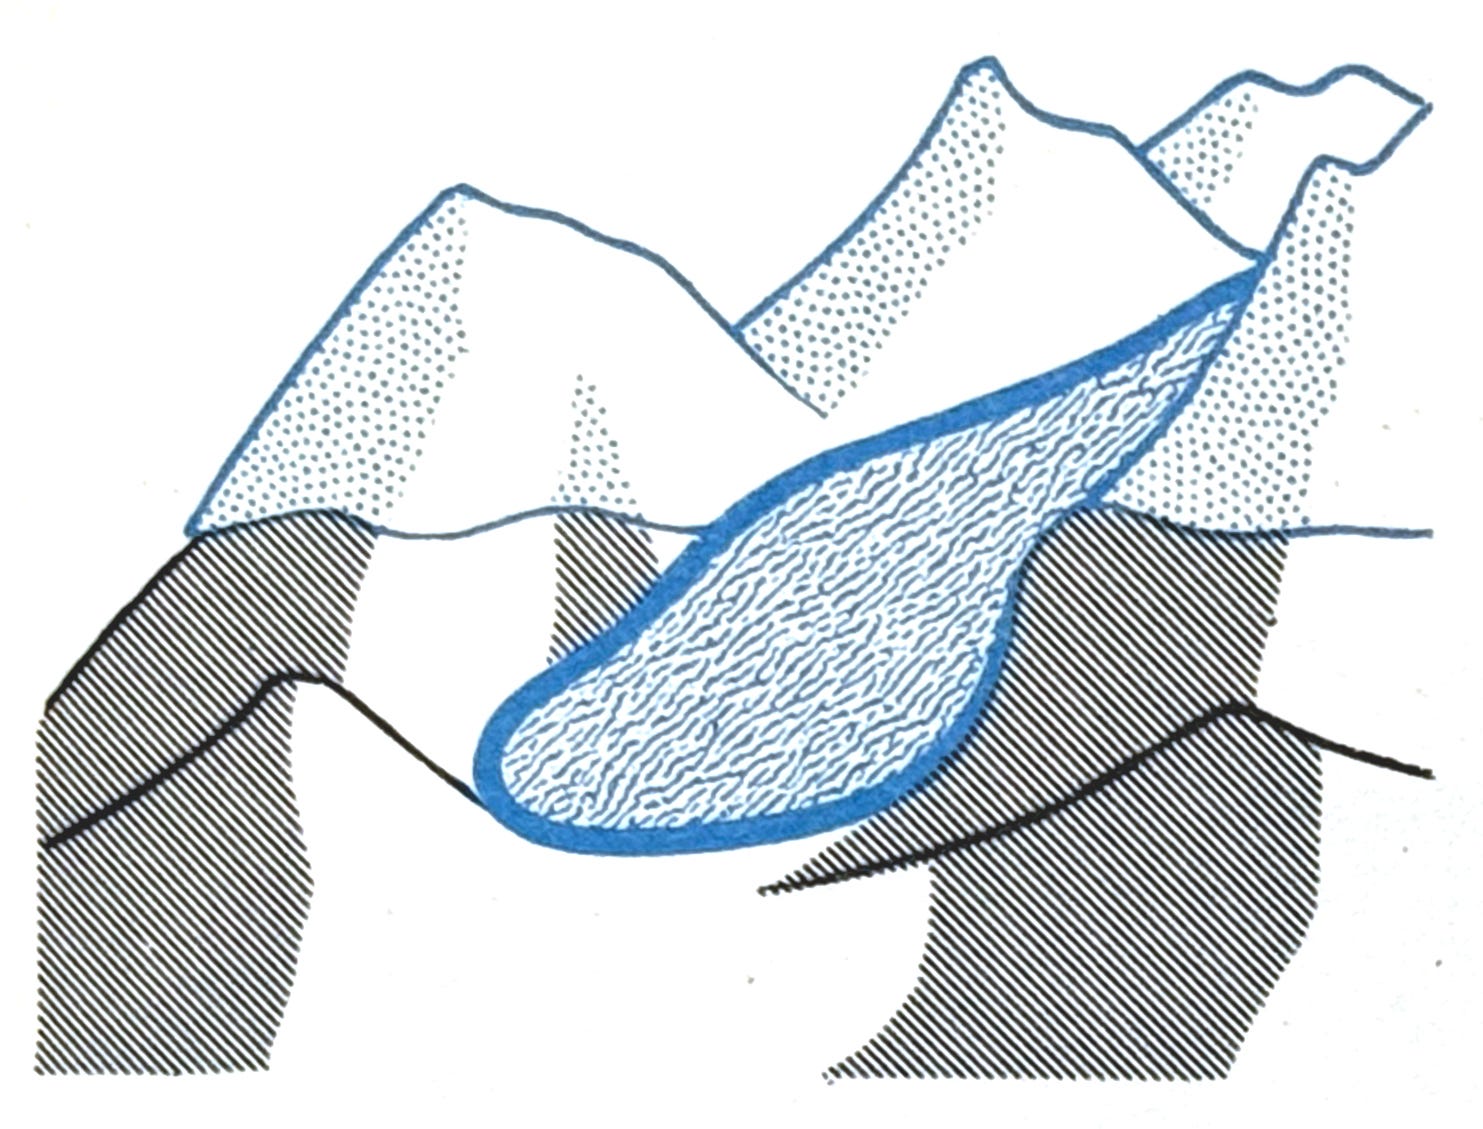
Marie Neurath’s diagrams are my primary reference for the Maps For Kids aesthetic. One of the distinctive features of her children’s books is their fill patterns.
For example, notice the diagonal, dot, and flow patterns in this glacier detail from The Wonder World of Snow and Ice.
It’s rather restricted compared to Neurath’s fabulous and occasionally overlapping canyon layers in The Wonder World of Land and Water.
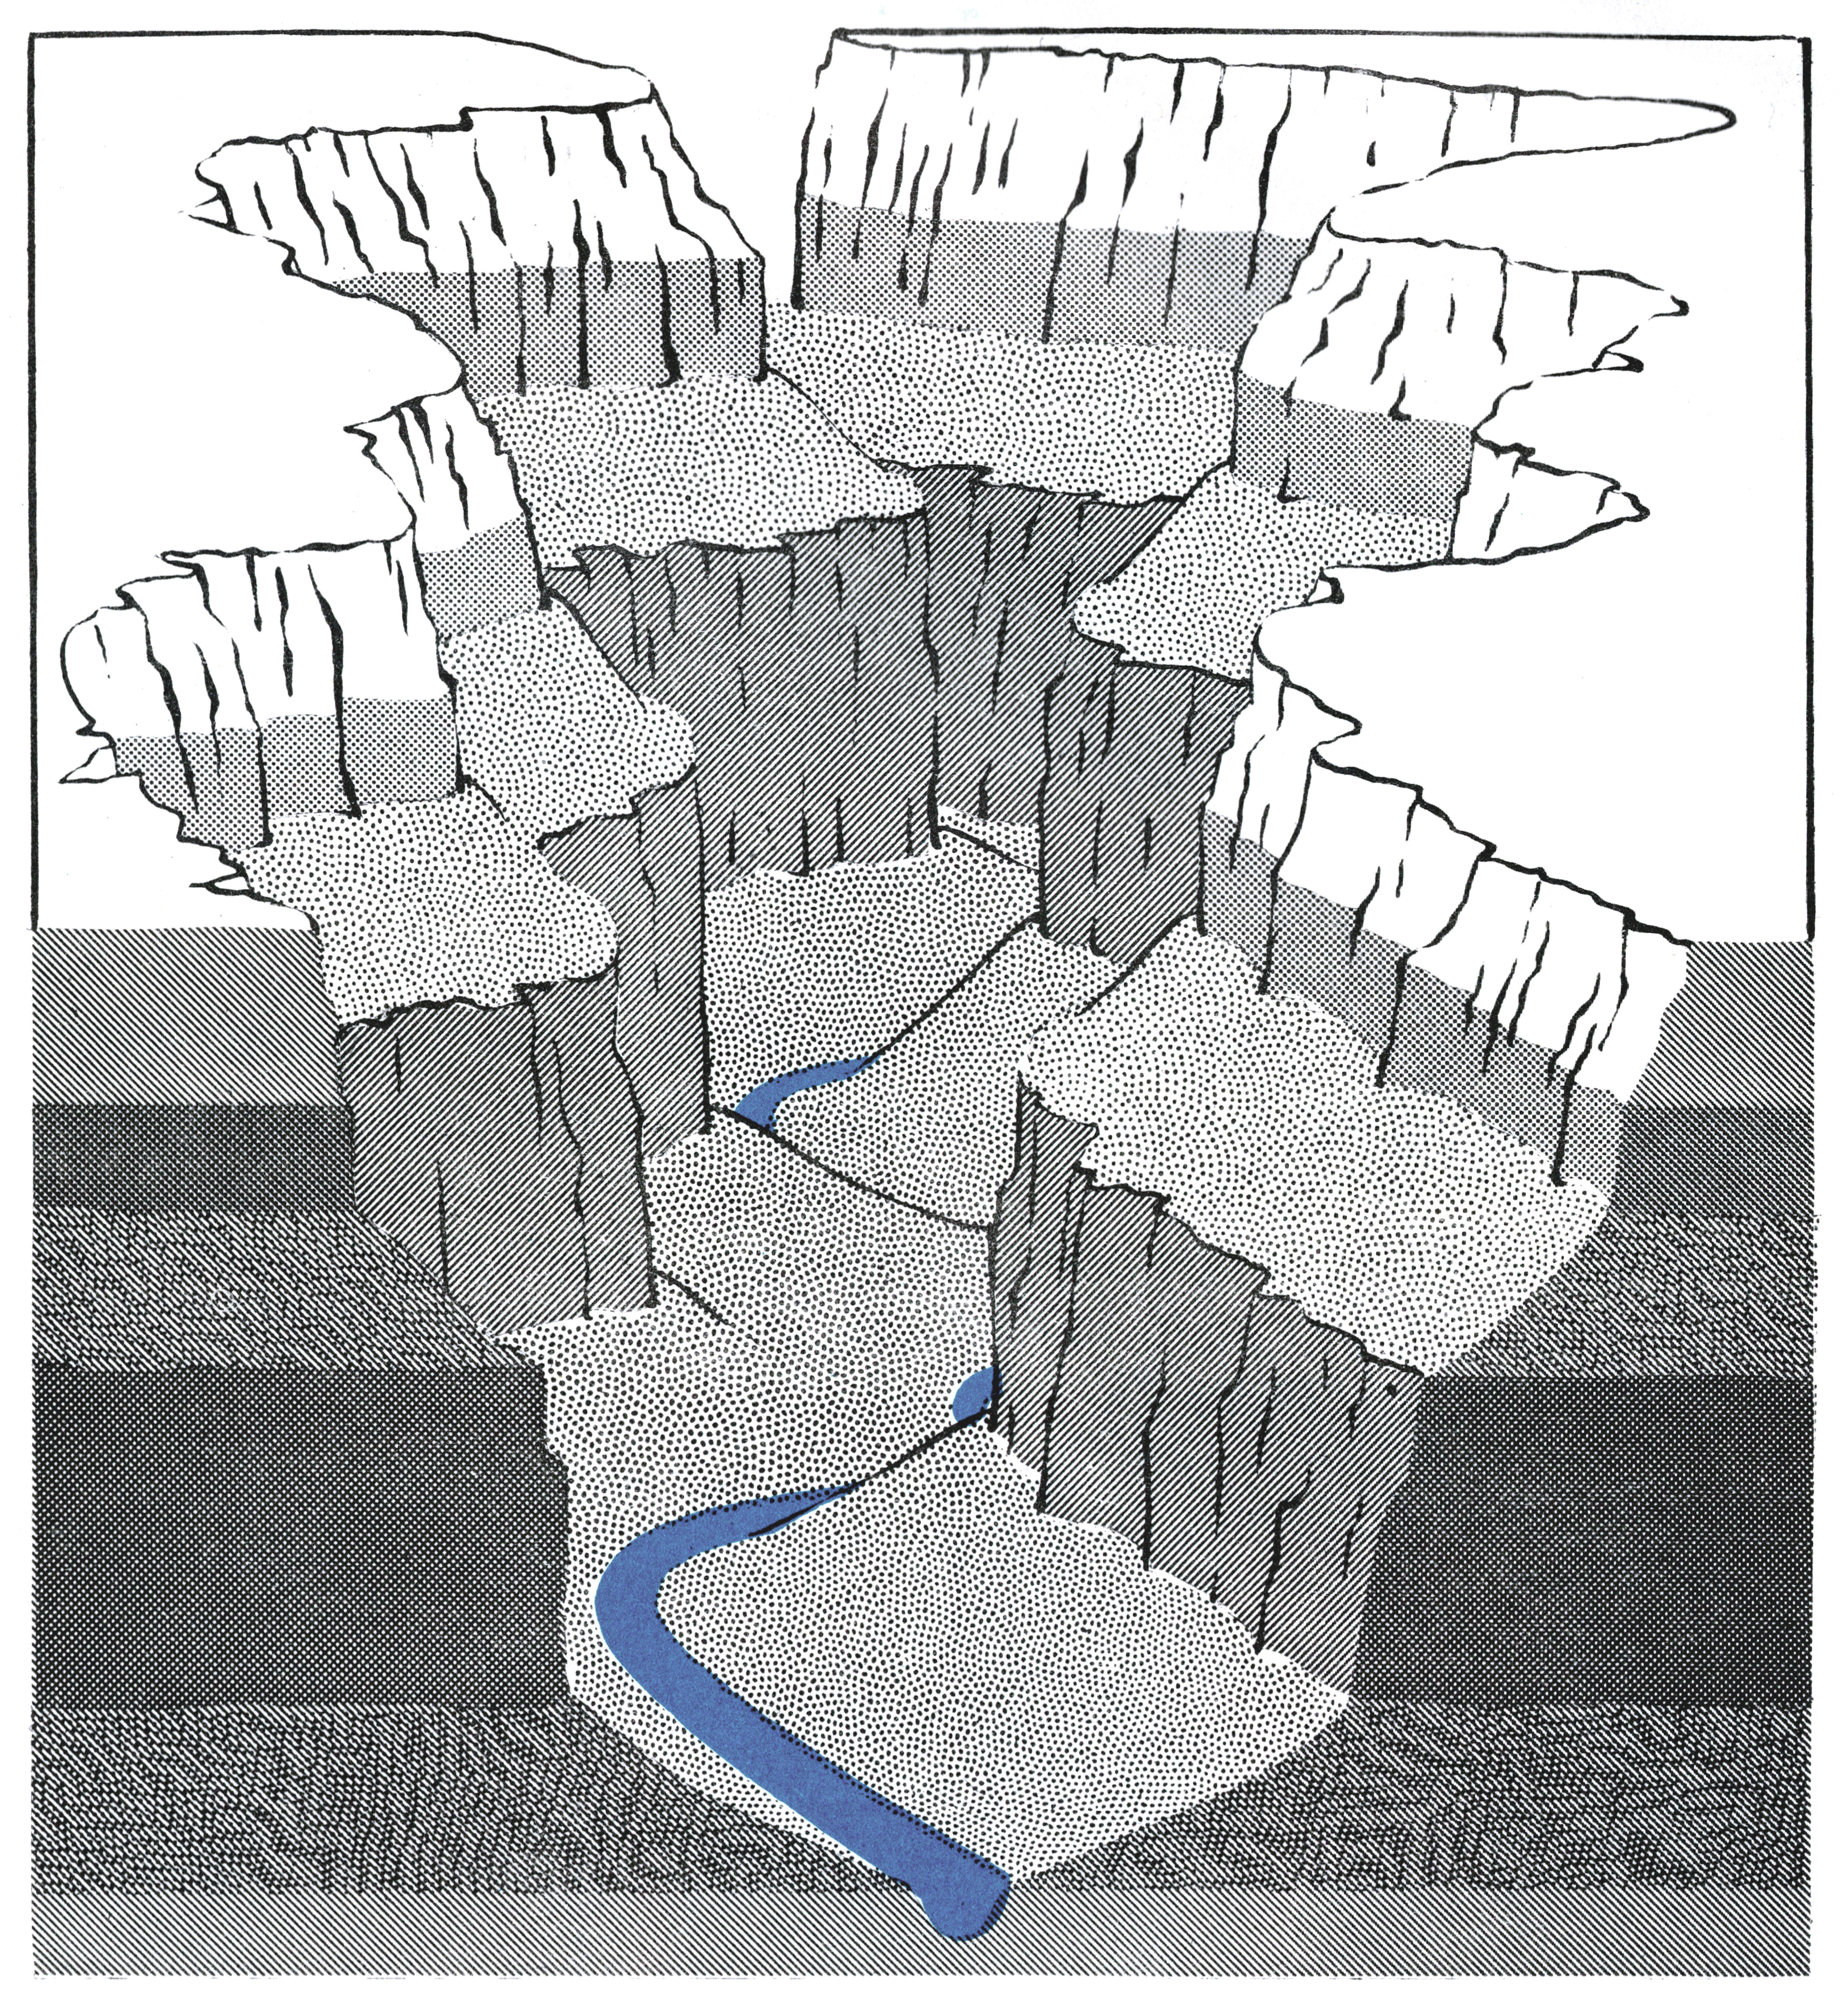
Both graphics feature a “festooned” dot pattern. Look closely. It is not a random assortment. The dots are arranged in fanning arcs that shimmer and disappear as you focus your eyes.
A hand-stippled pattern was patented in 1900 by Benjamin Day. His arcs overlap constantly in a way that allows the pattern to continue in any direction. Here is my imperfect digital adaptation of the design from his patent.

The world of “Ben Day” patterns expanded across the twentieth century. From an excellent history of printing via Legion of Andy:
Day patented a new way of producing what would later be called “mechanical tints.” His idea was to save some of the time and effort which was being spent drawing dots and lines by hand in the printing business. His was not the first such idea, but it was the one which dominated the field for decades to come. From a 21st century perspective it is impossible to imagine just how many dots and lines were being hand-drawn (and/or engraved) in those days. ... For about 60 years, that success was on a huge scale.
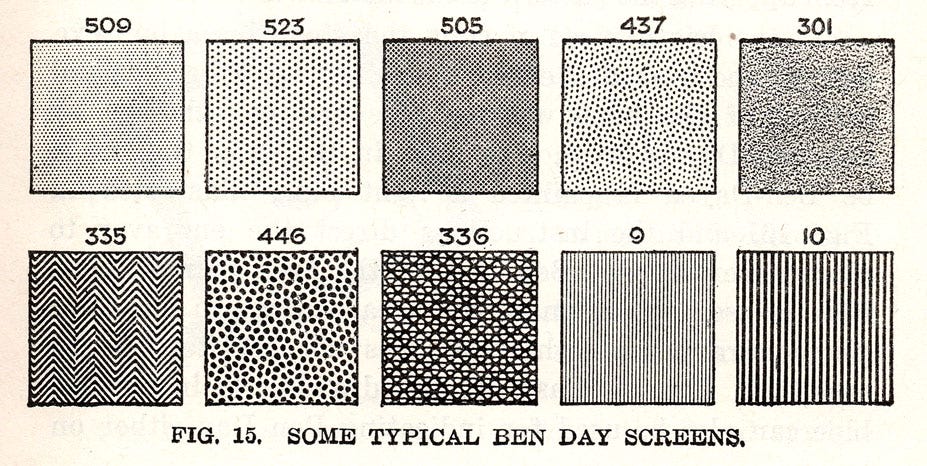
There are hundreds and hundreds of similar fill patterns that, to my best searching, are completely lost to our digital creative ecosystem. Some would be difficult to reclaim without serious graphic research.
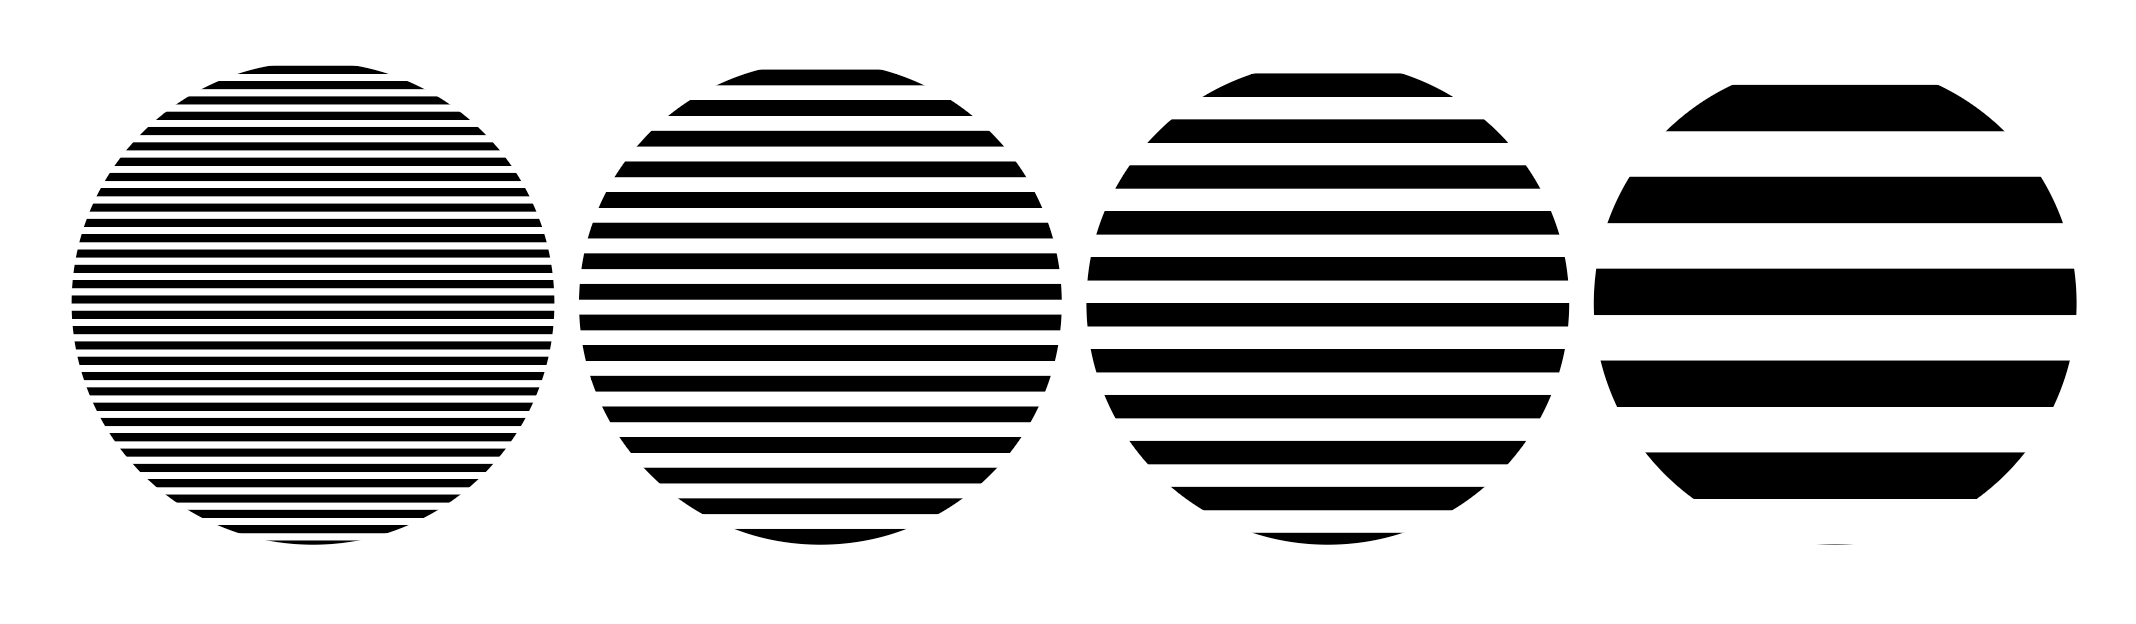
Fill patterns allow a minimum number of inks to be maximally expressive. They are underutilized in modern information graphics.
For example, each of the following line patterns has an equivalent 50% value, halfway between black and white. But they achieve that 50% in different ways that can be quantified, affording a new and perhaps attractive channel of expression.
Next I will share a little more about what I have figured out, so far, about hacking these fill patterns. (In short, I’m rolling my own.)
But first, I’m spilling my guts—getting personal and showing my secrets. It is too sensitive to share completely in public, so the rest of this edition is for paying subscribers.
