One of the favorite requests I get is to help someone choose a data-graphics book. The last person to ask my help was one of my Cooper Union students. So, they are my audience today. But I think you may want to listen too.
My design library includes Playfair pie charts, John Venn diagrams, Nightingale roses, and Sankey sankeys. A shelf full of 1920s dataViz textbooks, another shelf of Neurath Istoypes, and a couple dozen poorly-bound 21st-century softbacks. Some charts by good guys, some charts by bad guys, mostly charts by people trying to make a buck. It’s not that I need all these. But once one gets locked into a serious book collection, the tendency is to push it as far as you can.
My arms-reach access to this library gives me an edge as a practicing designer. Impractically, my love of these books propelled me to found Visionary Press in pursuit of creating spectacular books about information graphics.
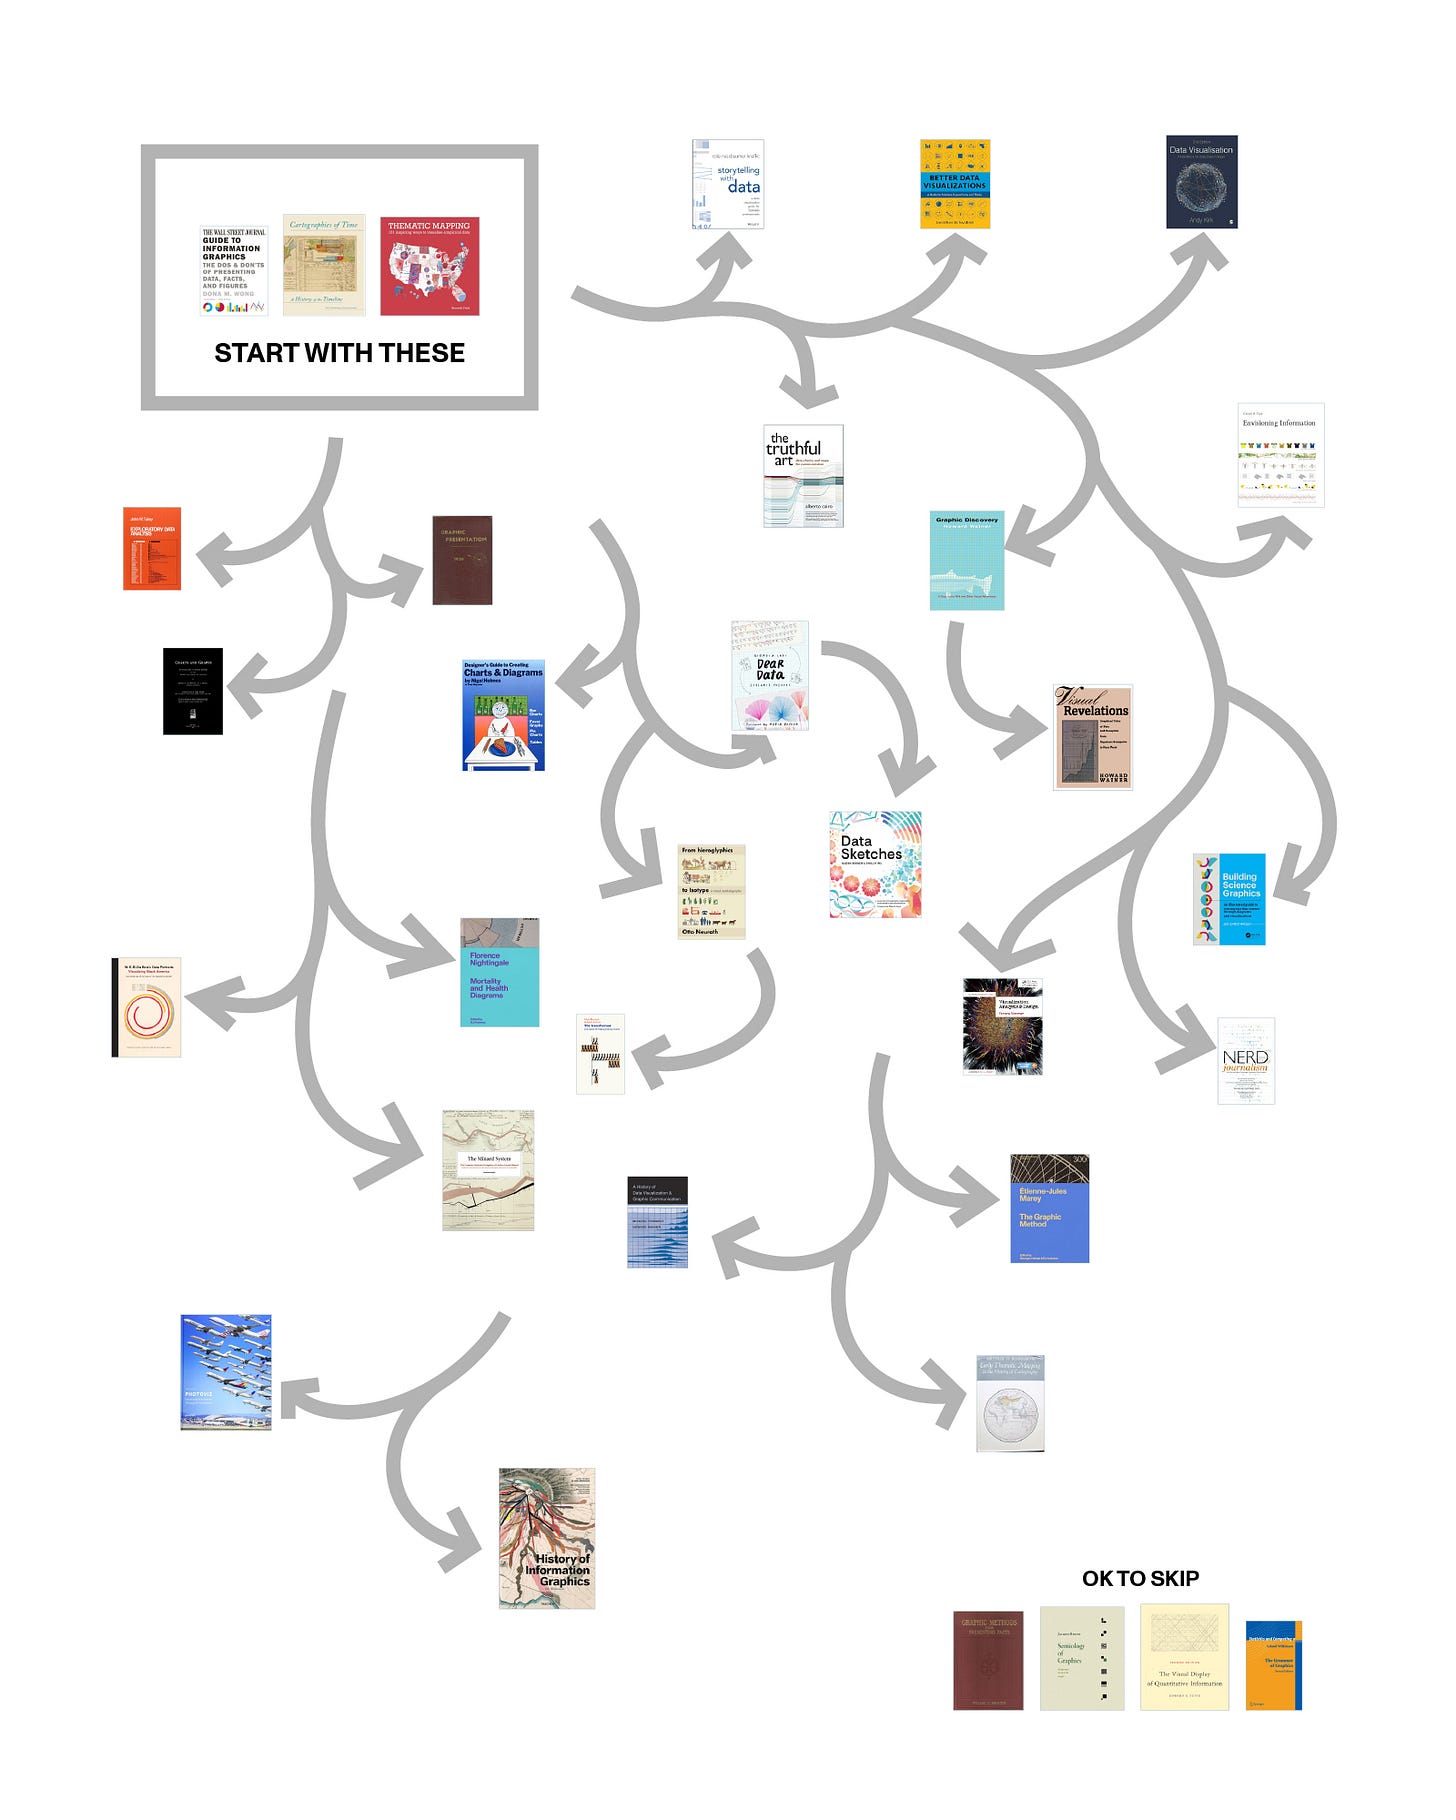
What follows are some suggestions for how to start building your own library: What to read first, and then what to read next. Each of the books is about data graphics. Books that merely feature data graphics are not included. I’ve included Amazon affiliate, Internet Archive, and other links as relevant. You can also find similar information in this Google sheet.
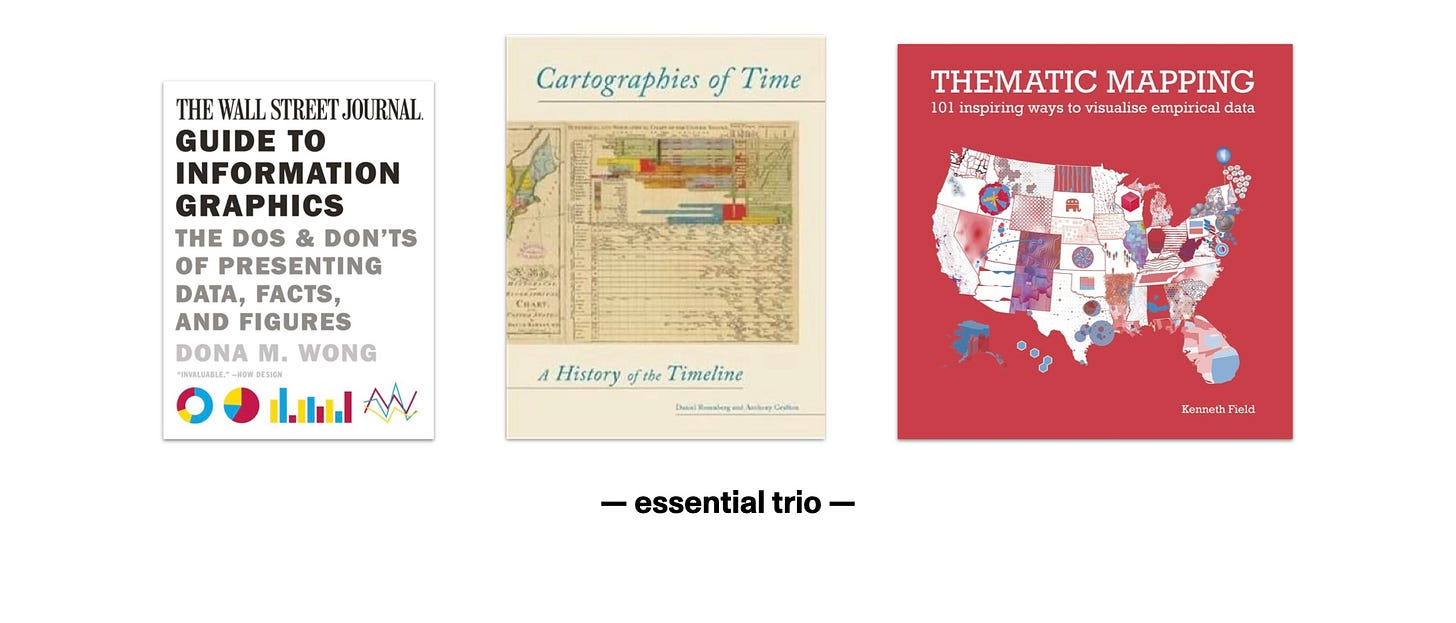
Start with this essential trio. They give a complementary mix of how-to basics, historic tradition, chart types, loads of examples, and colorful presentation. Each is a well-presented and enjoyable experience. Any is good on its own, but the group is particularly strong when read together.
The WSJ Guide to Information Graphics by Dona M. Wong (2013, 160 pages) [Amazon] [Internet Archive]
Cartographies of Time by Daniel Rosenberg and Anthony Grafton (2010, 272 pages) [Amazon] [Internet Archive]
Thematic Mapping by Kenneth Field (2022, 296 pages) [Amazon]
The following set, listed chronologically, are all magnificent classics that still deserve your attention. (Later, we will see a list of famous books that are OK to skip.) Each of these is pretty long. Reading any cover-to-cover is not necessary. Instead, read their introductions, Karsten’s conclusion, and then bounce around to what excites you most.
Charts and Graphs by Karl G. Karsten (1923, 768 pages) [Internet Archive]
Graphic Presentation by Willard C. Brinton (1939, 522 pages) [Internet Archive]
Exploratory Data Analysis by John Tukey (1977, 712 pages) [Amazon]
Buying all of these would be expensive. You probably won’t find a copy of Brinton, it’s rare. I recommend reading Karsten and Brinton for free at the Internet Archive. Borrow Tukey from your local library. If you read the first essential trio and internalized Karsten and Tukey you would become an information-design powerhouse.
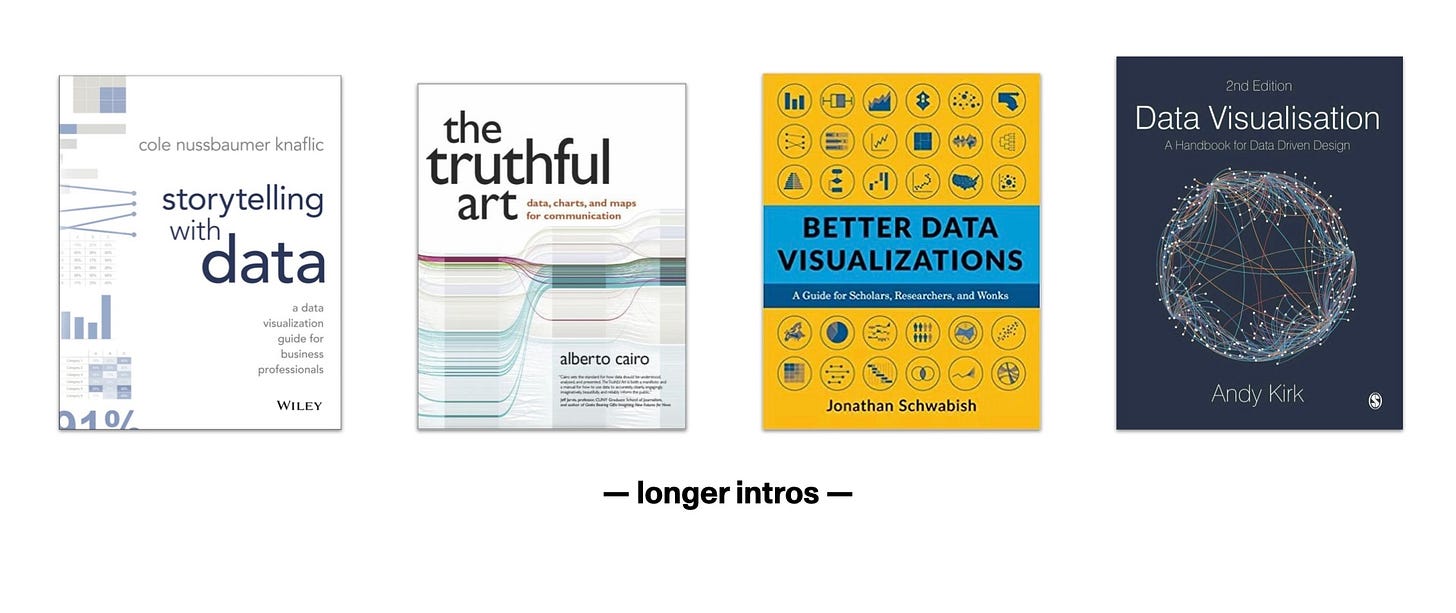
Wong’s Guide to Information Graphics is short. I wish there was an even smaller introductory handbook to making charts. (Perhaps that’s a to-do for me?) If you find yourself instead wanting more than Wong, then try one of the following general intro-books.
Storytelling with Data by Cole Nussbaumer Knaflic (2015, 288 pages) [Amazon]
The Truthful Art by Alberto Cairo (2016, 400 pages) [Amazon]
Better Data Visualizations by Jonathan Schwabish (2021, 464 pages) [Amazon]
Data Visualisation by Andy Kirk (2019, 328 pages) [Amazon]
Personally, a Cairo book was my gateway into the field. Maybe it will be yours too. Knaflic is the most talented chart-presenter of the lot and shows you how to do it too. Today, I reference Schwabish the most because of its chart-by-chart structure.
Even though it’s not the longest book of the lot, Kirk feels like the most comprehensive. (Maybe it’s his British accent.) He is working on a third edition right now, so you may want to choose that book when it comes out because it will be the newest of the lot.
I recommend reading any general-intro today, and pacing the rest for later in your career for a regular refresh on the basics.
There are also some overview books that have a more specific perspective. Nerd Journalism is my favorite Cairo. Munzer has an authoritative research-backed perspective, but it is in need of an update to account for the past ten years of findings.
Nerd Journalism by Alberto Cairo (2017, 272 pages) [Dropbox PDF]
Building Science Graphics by Jen Christiansen (2022, 333 pages) [Amazon]
Visualization Analysis & Design by Tamara Munzer (2014, 428 pages) [Amazon]
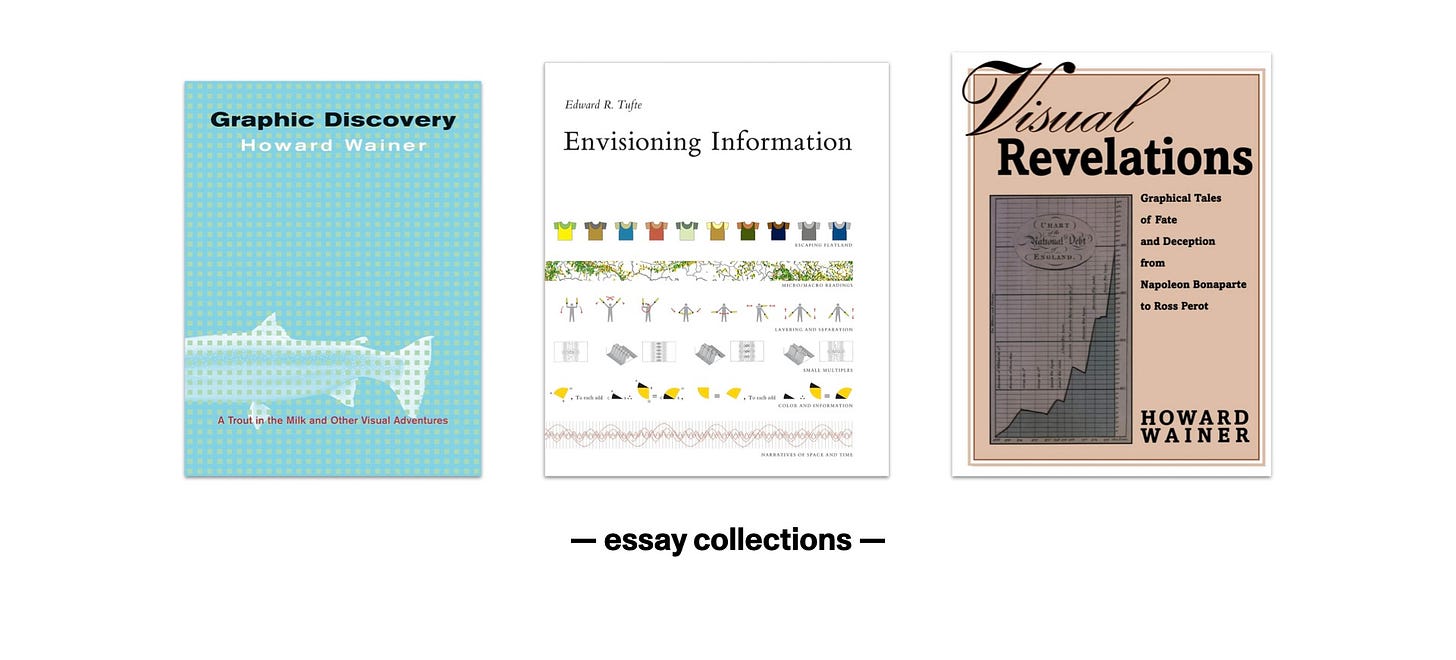
If you like your lessons more obliquely, then consider reading Howard Wainer or Edward Tufte. Each made a career of assembling short essays into books. Wainer is better at teaching a lesson. Tufte is better at making pretty books.
Graphic Discovery by Howard Wainer (2004, 208 pages) [Amazon]
Envisioning Information by Edward R. Tufte (1990, 126 pages) [Amazon]
Visual Revelations by Howard Wainer (1997, 191 pages) [Amazon]
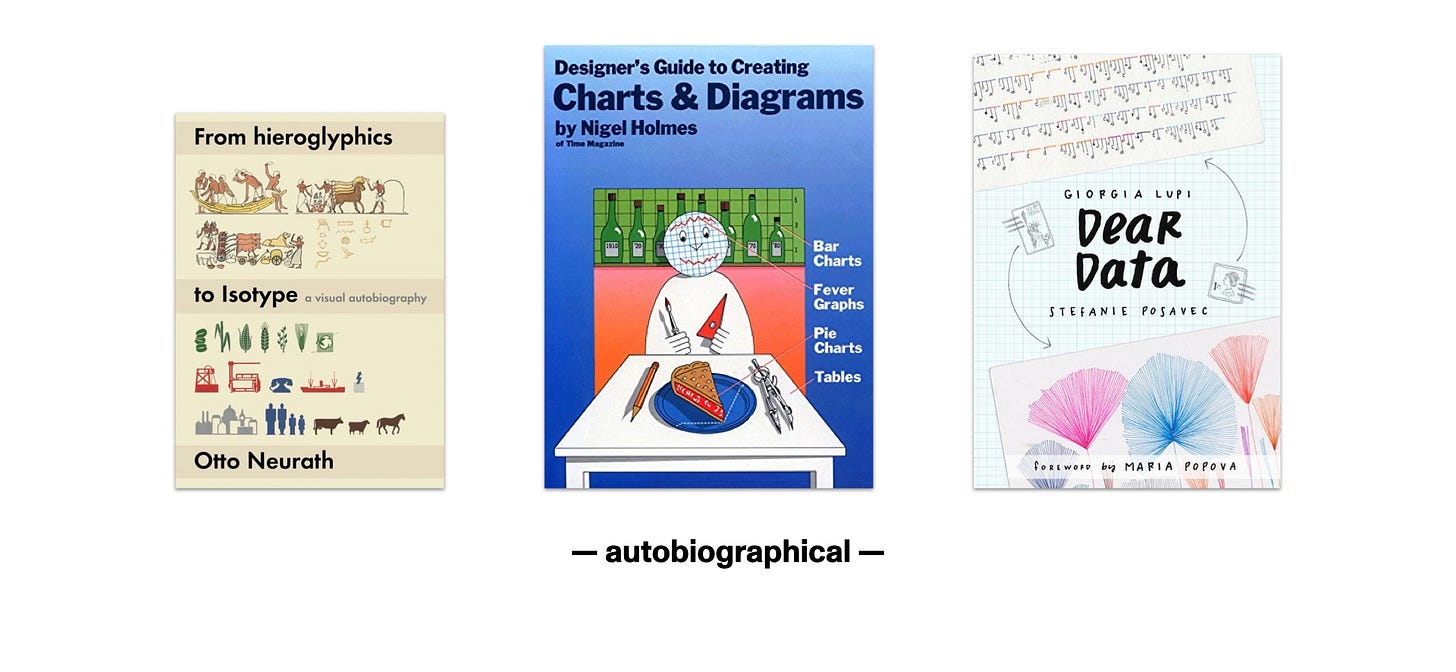
If you want to go behind the scenes with a champion designer to see their sketches, hear their stories, and glimpse their process, then consider this group.
From Hieroglyphics to Isotype by Otto Neurath (2010, 224 pages) [link]
Designer's Guide to Creating Charts and Diagrams by Nigel Holmes (1984, 144 pages) [Amazon] [Internet Archive]
Dear Data by Giorgia Lupi and Stefanie Posavec (2016, 288 pages) [Amazon]
Further: If you want to learn more from the Isotype crowd then find a used copy of The Transformer by Marie Neurath (2008, 80 pages). If you want another chronicle of cross-Atlantic dueling creatives, but with code, then check out Data Sketches by Nadieh Bremer and Shirley Wu (2021, 428 pages) [Amazon].
If, instead, you want to hear a creator’s story from someone else, then consider any of these designer monographs (including one by me).
W. E. B. Du Bois's Data Portraits (2018, 144 pages) [Amazon]
Florence Nightingale: Mortality and Health Diagrams by RJ Andrews (2022, 240 pages) [Amazon] [Visionary]
The Minard System by Sandra Rendgen (2018, 176 pages) [Amazon]
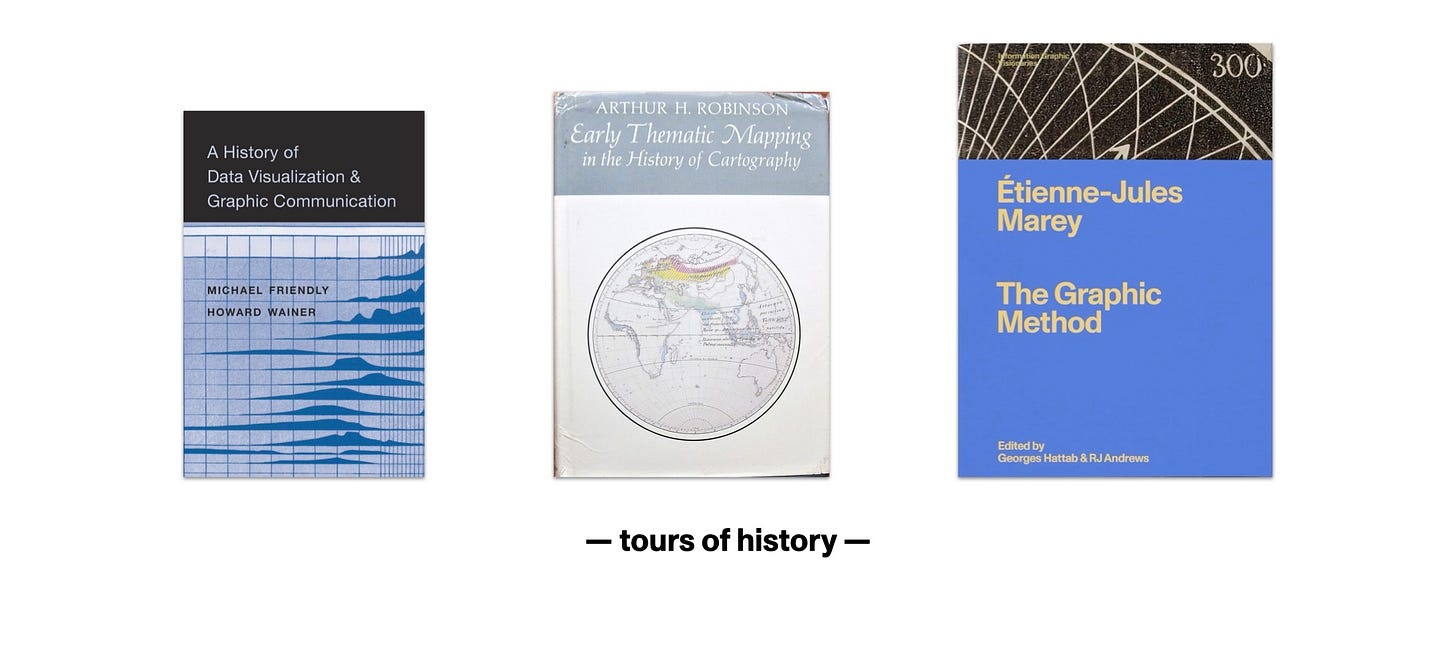
If these monographs make you curious about the history of the field, then read one of our many histories, spanning from Friendly and Wainer (2021) all the back to Marey’s 1878 Graphic Method (which was recently translated in 2022 by me and Hattab).
A History of Data Visualization and Graphic Communication by Michael Friendly and Howard Wainer (2021, 320 pages) [Amazon]
Early Thematic Mapping in the History of Cartography by Arthur H. Robinson (1982, 280 pages) [Amazon] [Internet Archive]
Étienne-Jules Marey: The Graphic Method by by Georges Hattab and RJ Andrews (2022, 168 pages) [Amazon] [Visionary]
Further, if narrative history is your thing, then track down a PDF of Howard Funkhouser’s “Historical Development of the Graphical Representation of Statistical Data” from 1937—it is the modern foundation for understanding our tradition.
If you don’t care too much for the story and just wants lots of pretty pictures. Or, if you are looking for an impressive gift, then consider Photoviz or any of the XL Taschen volumes.
Photoviz by Nicholas Felton (2016, 240 pages) [Amazon]
History of Information Graphics by Sandra Rendgen (2019, 462 pages) [Amazon]
(There was a time when I would start every day by flipping to a page of a big Taschen information-graphics tome. I need to start doing that again, but it’s hard to find the space!)
Any recommendation for what to do is strengthened by advice on what not to do. The following books all made huge contributions and deserve our respect. But they are skippable today (especially in favor of other books by Brinton and Tufte that I find more enchanting). You have my permission to disregard all of these.
Graphic Methods for Presenting Facts by Willard C. Brinton (1914, 396 pages) [Internet Archive]
Semiology of Graphics by Jacques Bertin (1967, 456 pages) [Amazon]
The Visual Display of Quantitative Information by Edward R. Tufte (1983, 197 pages) [Amazon]
The Grammar of Graphics by Leland Wilkinson (2005, 709 pages) [Amazon]
If you like this list then you might also enjoy my previous recommendation for books without data for the data professional.
Of course, biases abound. These are just books. You can also learn from academic papers, web videos, and blogposts. While I’ve read a lot, I haven’t read everything. And when I have read, it’s been at a particular moment in my particular journey. So, this is just one list by one guy made on one day. There are several hundred data-graphics books for me to read. What do you recommend?
Finally, my opus Info We Trust is not on this list. I’m working on bringing it back to life and will need all your help to make that reality. More, soon. Until then.
Onward!—RJ
About
Data storyteller RJ Andrews helps organizations solve high-stakes problems by using visual metaphors and information graphics: charts, diagrams, and maps. His passion is studying the history of information graphics to discover design insights. See more at infoWeTrust.com.
RJ’s recently published series, Information Graphic Visionaries, a new book series celebrating three spectacular data visualization creators. With new writing, complete visual catalogs, and discoveries never seen by the public. His first book is Info We Trust, How to Inspire the World with Data., is currently being remastered for a new edition.



This is a great list, thanks so much for putting it together. Bookmarked! Just when I thought I was familiar with most books on dataviz, there are more gems I've never even heard of. I have an idea to create a poster/chart of dataviz books, somehow ordered and grouped. Or a timeline. Or a family tree history of publications about dataviz. There is so much data on dataviz now. Thanks for your contributions!