
Off-screen in the Wilds of Manhattan
What a New York exhibition taught me about the costs of creative triumph.

Welcome to Chartography.net — insights and delights from the world of data storytelling.
“Information graphics is a craft—a coordination of hand, eye, head, and heart—that expands understanding and empowers action.”
Those words introduced my recent show at 41 Cooper gallery in New York City—an experience that was, for me, both a high point and a draining test of what it takes to make something beautiful and real.
The exhibition had two sides—one personal, one collective.
The first part traced an intimate path through my new book Info We Trust ($39 from Visionary Press). Text, original artwork, and enlarged illustrations underscored how data storytelling is both an art and a science, bridging imagination and evidence.
The storyteller’s job isn’t to repeat the book—it’s to tell a good story. The exhibition’s goal wasn’t to convey the book (that would be foolish and impossible), but to use the book to put on a good show.
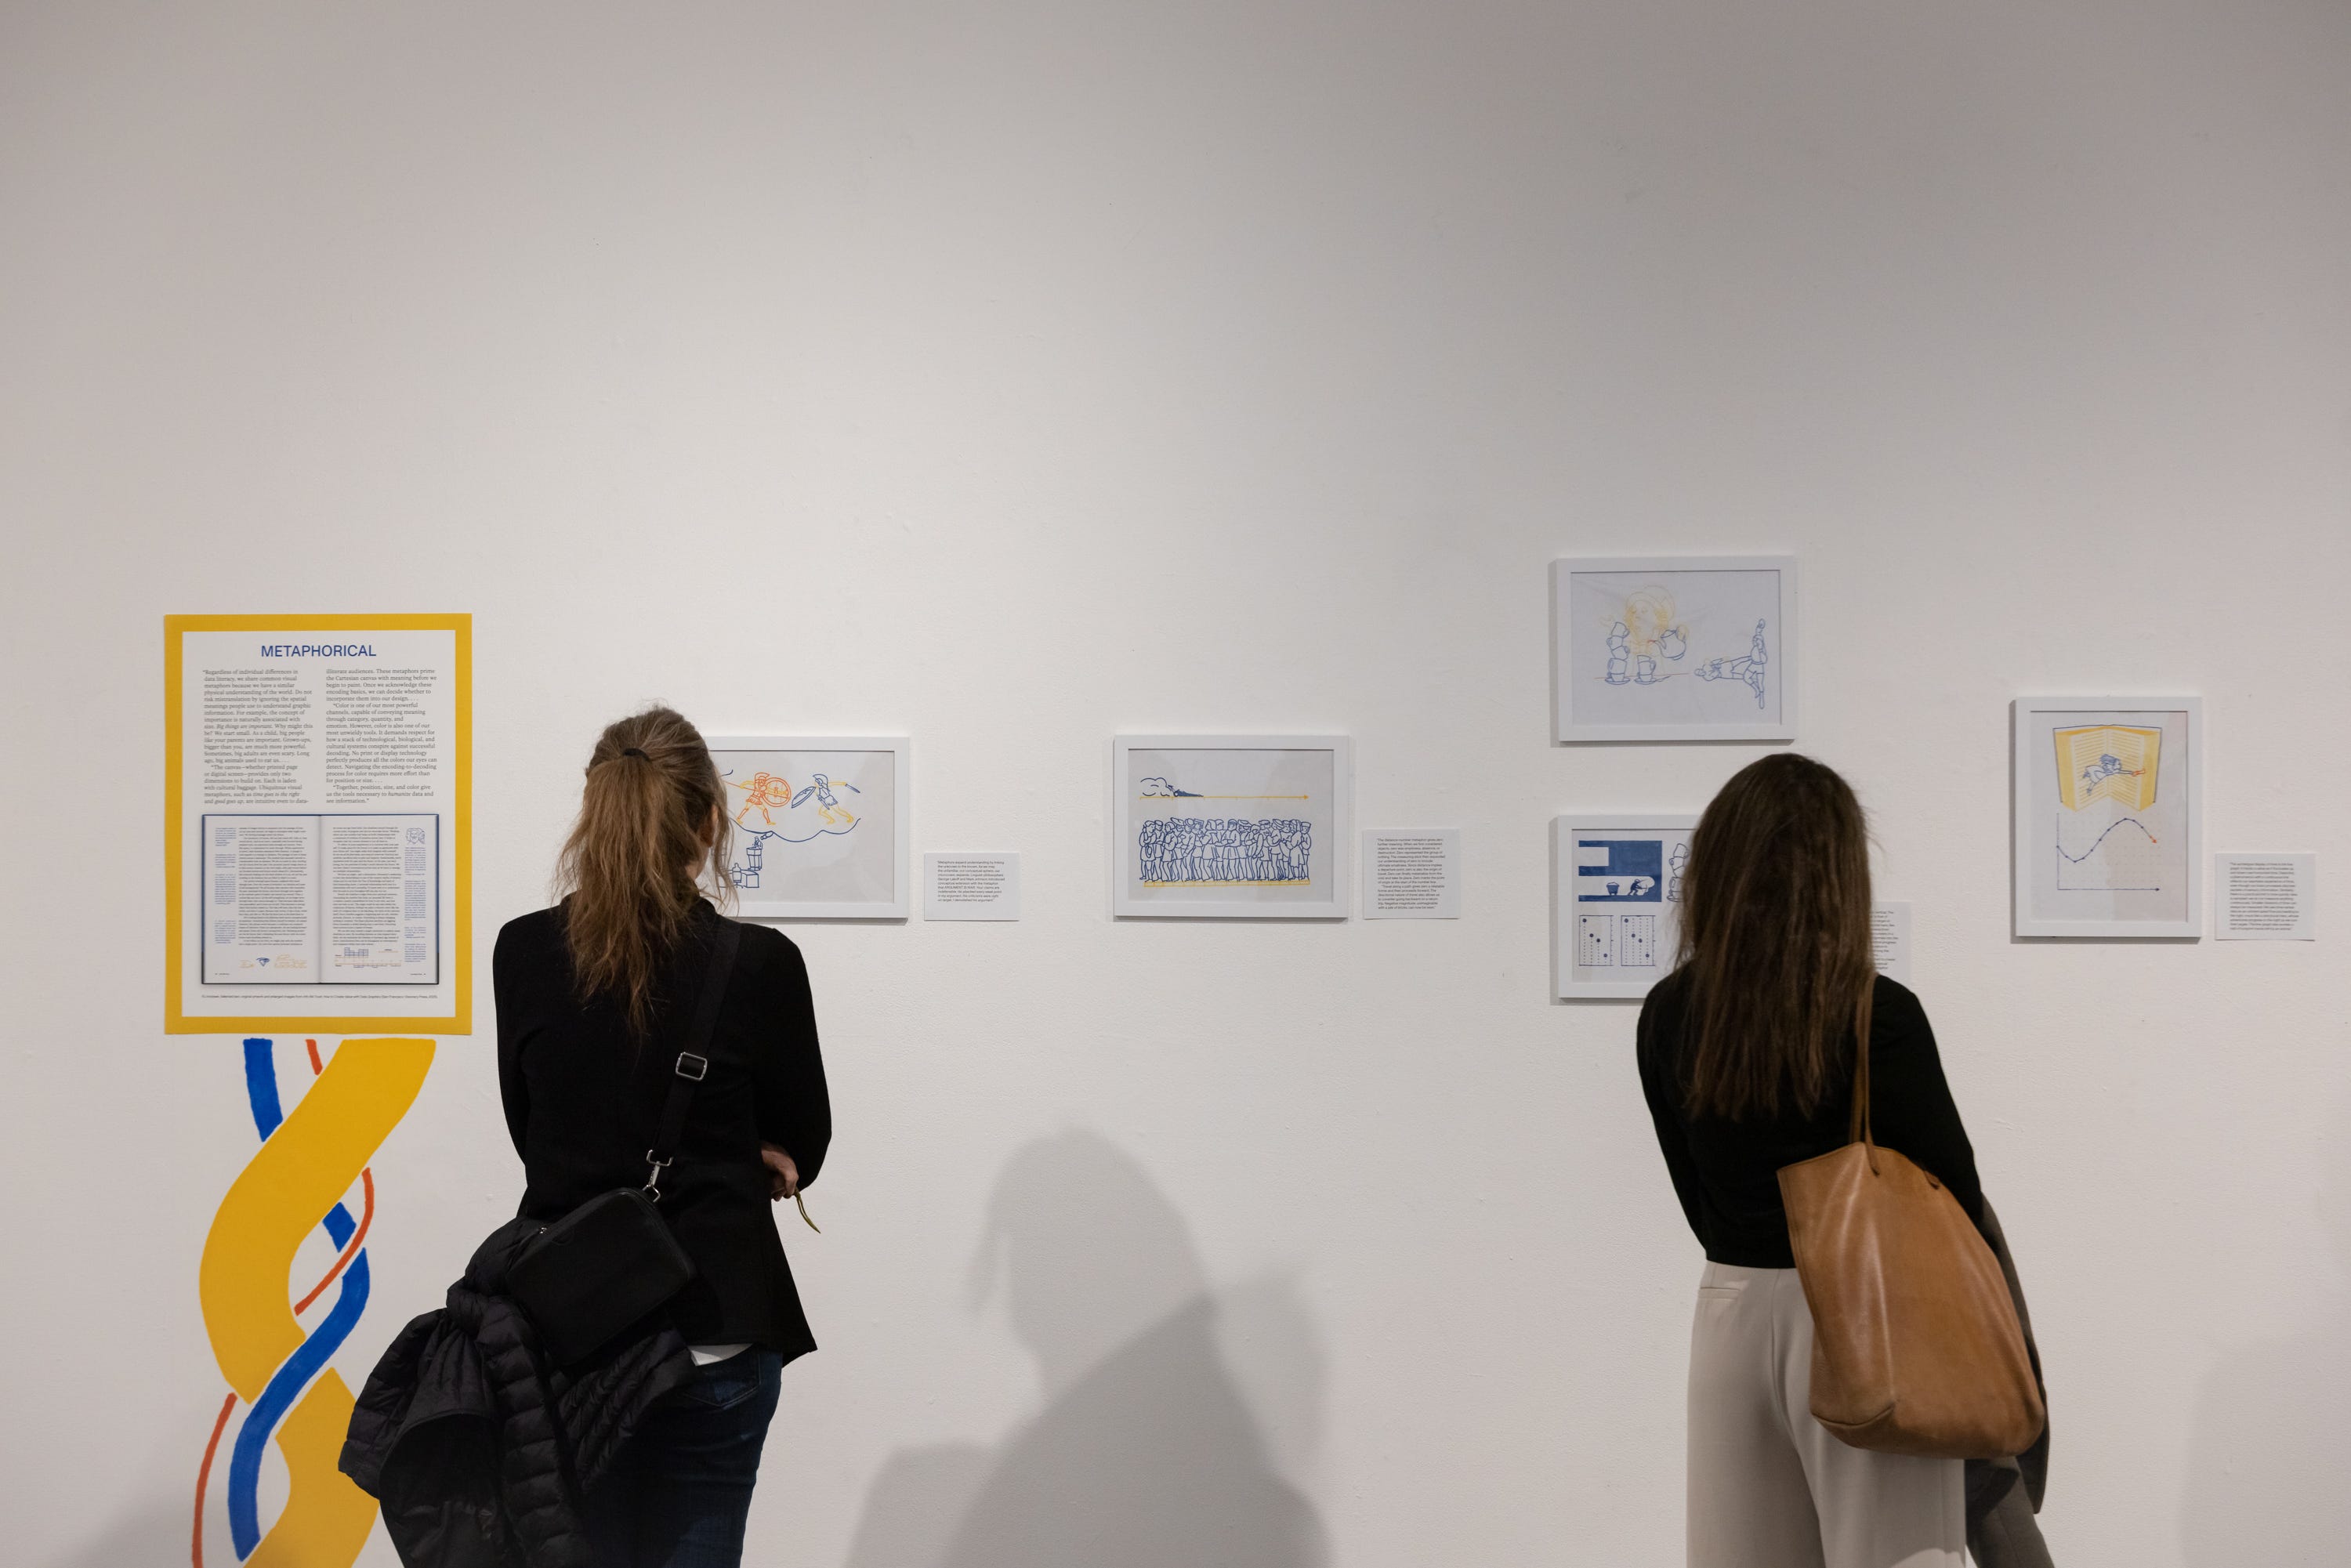
I used the other half of the gallery to celebrate the field of information design as a whole. Works by leading contemporary designers showcased today’s expanding visual vocabulary alongside historic examples chosen for aesthetic and thematic resonance. With each piece, I aimed to express my belief that information, when generously made for the audience, can illuminate and inspire.
It’s risky to split a narrative focus, but I believed this structure made the event richer. Doing so also allowed me to connect and strengthen ties to creators I admire. Ultimately, I believe including others’ work better elevated our field.
In the exhibition’s planning I was really hoping to create something cheerful. On the eve of its opening I stood surrounded by colorful works, anticipating what it might be like full of hungry eyes. I imagined that it would leave an impression on those who saw it and lead to more information-graphic adventures for me, and more impactful information graphics in our world.
I arrived to New York full of determination. It was magical watching my plan, designed digitally to the inch, come to life. (See that plan below—the magenta rectangles represent labels.) I was lucky to be coached beforehand by my Cooper Union host, and creator of a new data program, Cara Di Edwardo.

We used a product called phototext to enlarge my artwork. I was delighted to see a giant rendering of my chaos and order. Its power wasn’t just its size, but how its blue color glowed in the gallery. The phototext’s white background blended perfectly with the wall, fooling casual observers into thinking that I had redrawn the illustrations just for this gallery.
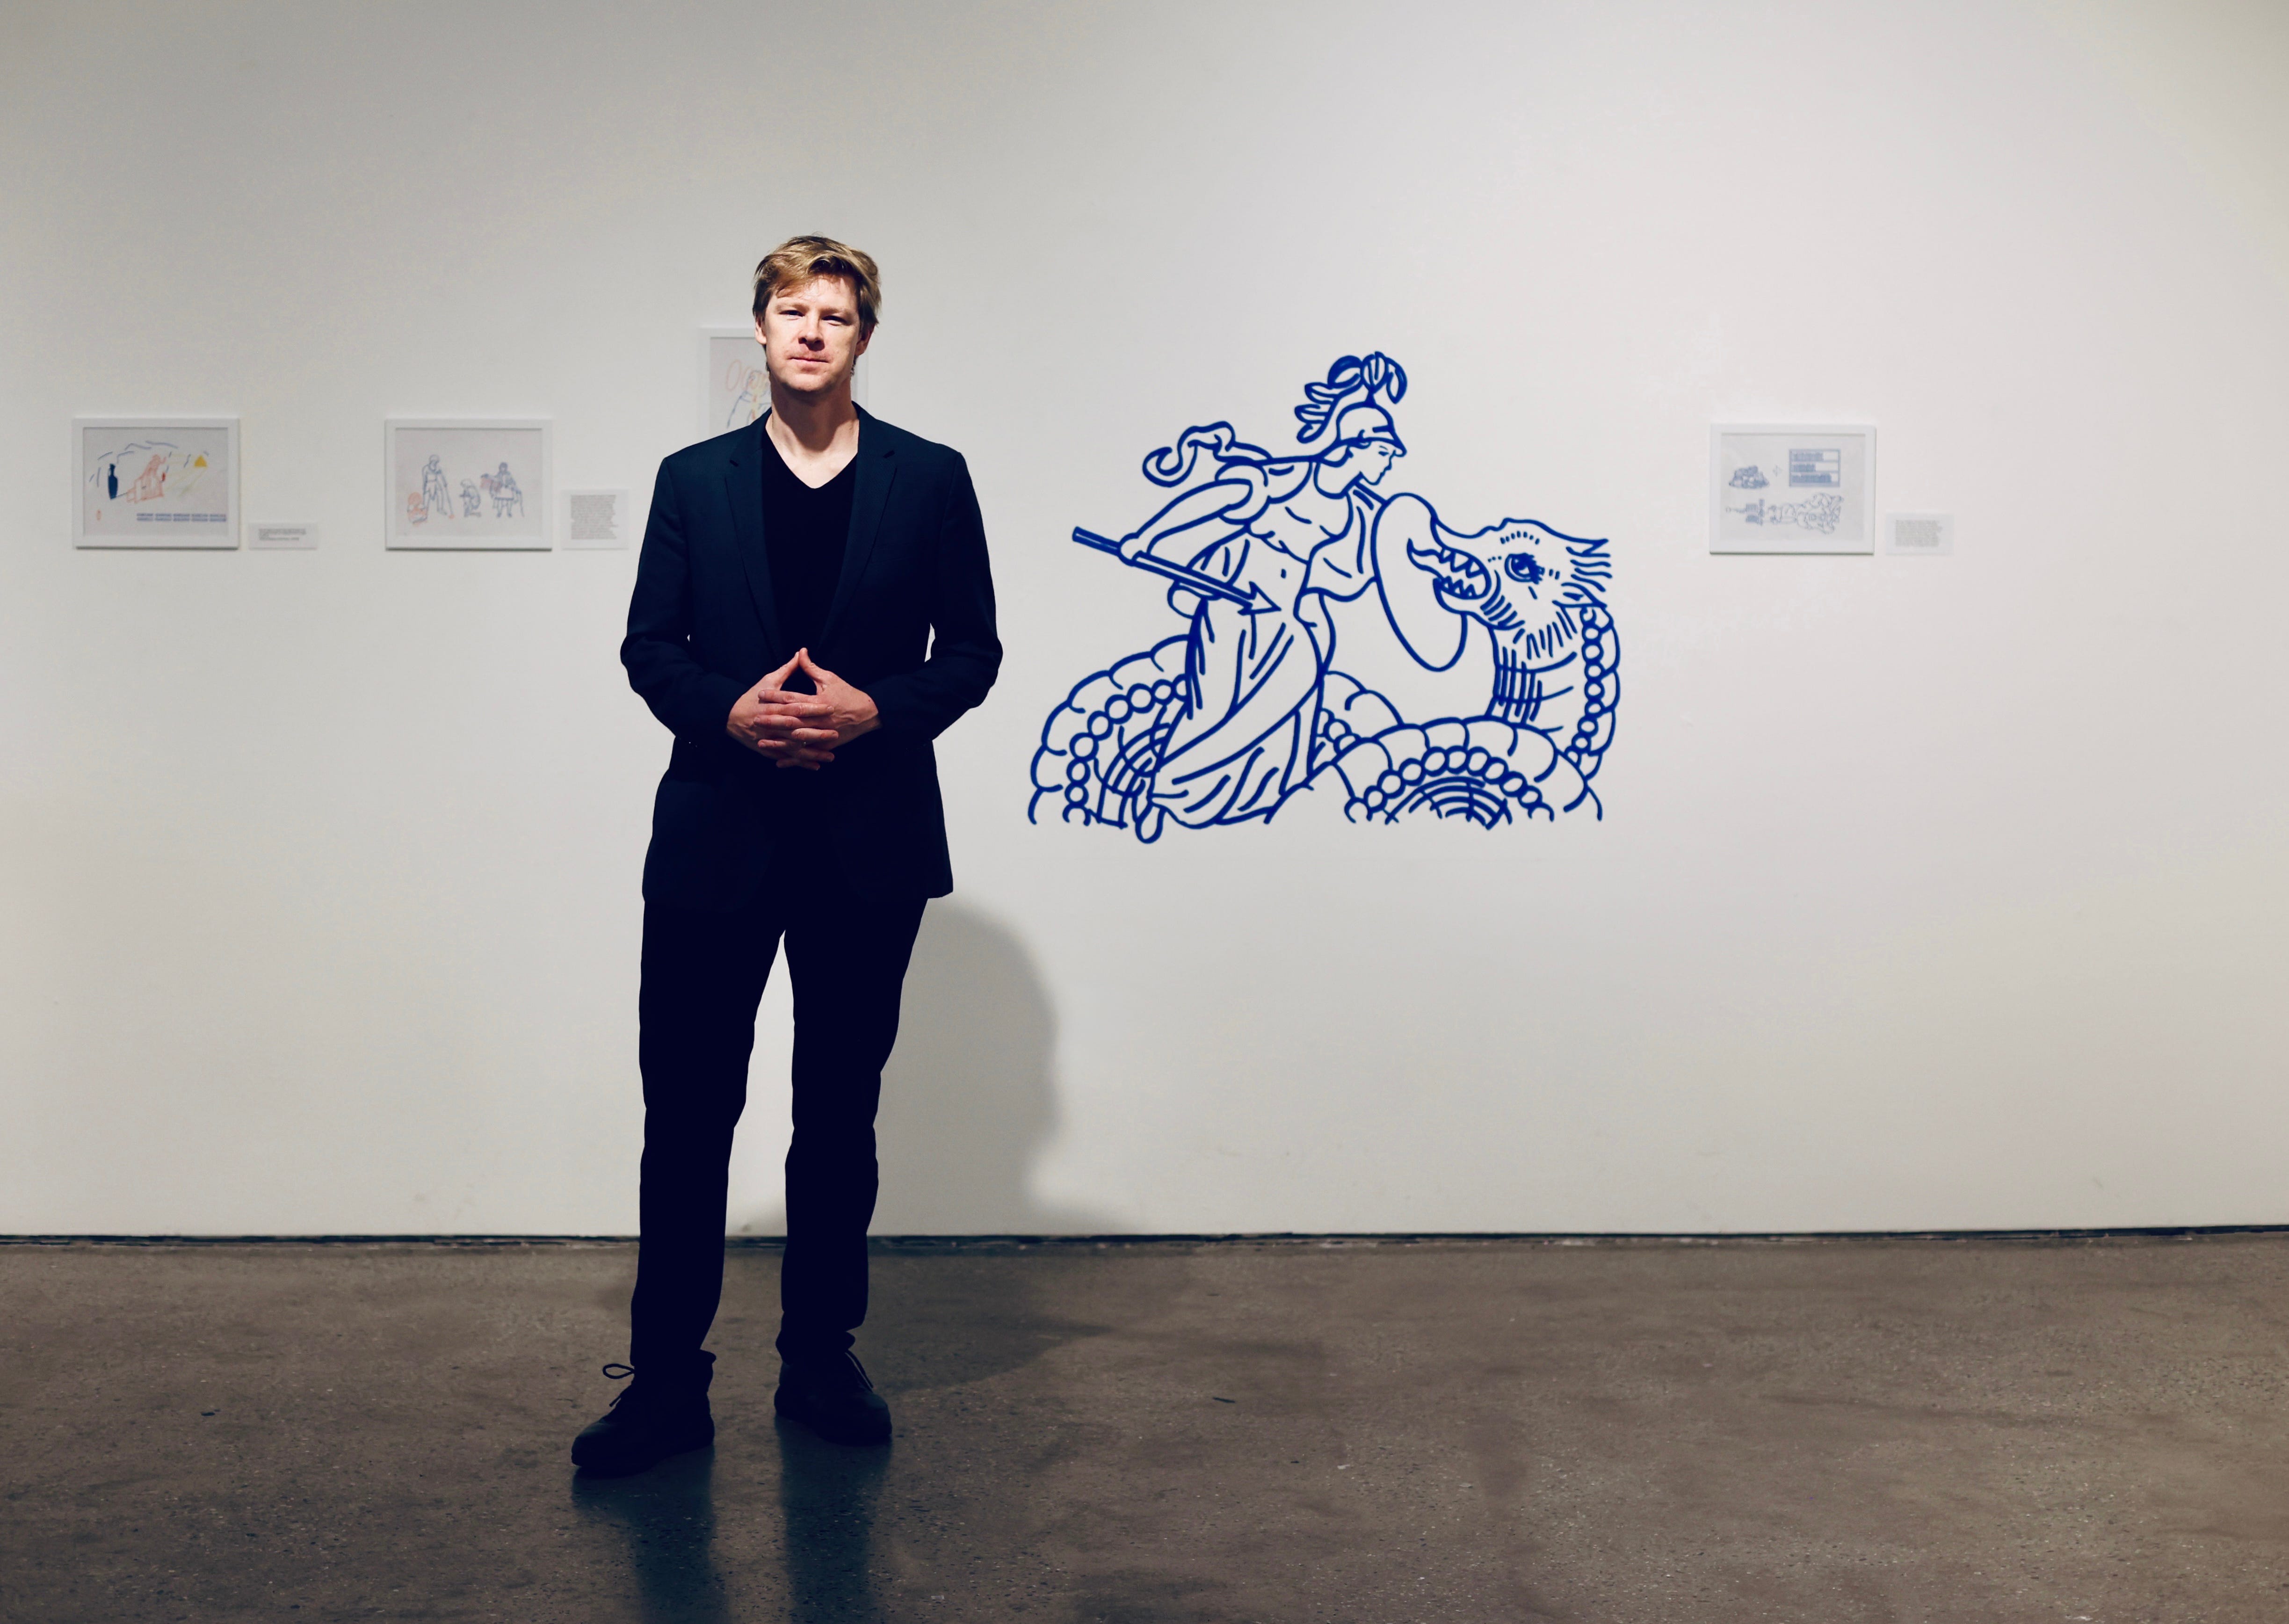
It takes an extreme amount of effort to make something feel effortless. To make it feel like it was always supposed to be there.
A group of New York friends aided with the install. New Yorkers are so serious about doing a good job. “Do it right or don’t do it at all.” Their intense commitment to putting together a professional presentation impressed me throughout my week.
I was also charmed by their kindness. We were not done installing as the sun set on the eve of opening. No one left. In fact, they made a call to bring in art-gallery support to help finish the work. They had the knowhow to mount all kinds of artwork—adapting at times to better showcase my unique collection of objects. They had tools and supplies on hand (laser level) or in nearby art shops (museum putty). They did not quit until each object received its own literal spotlight.
On the show’s second evening I gave an associated talk to a sold-out theater.
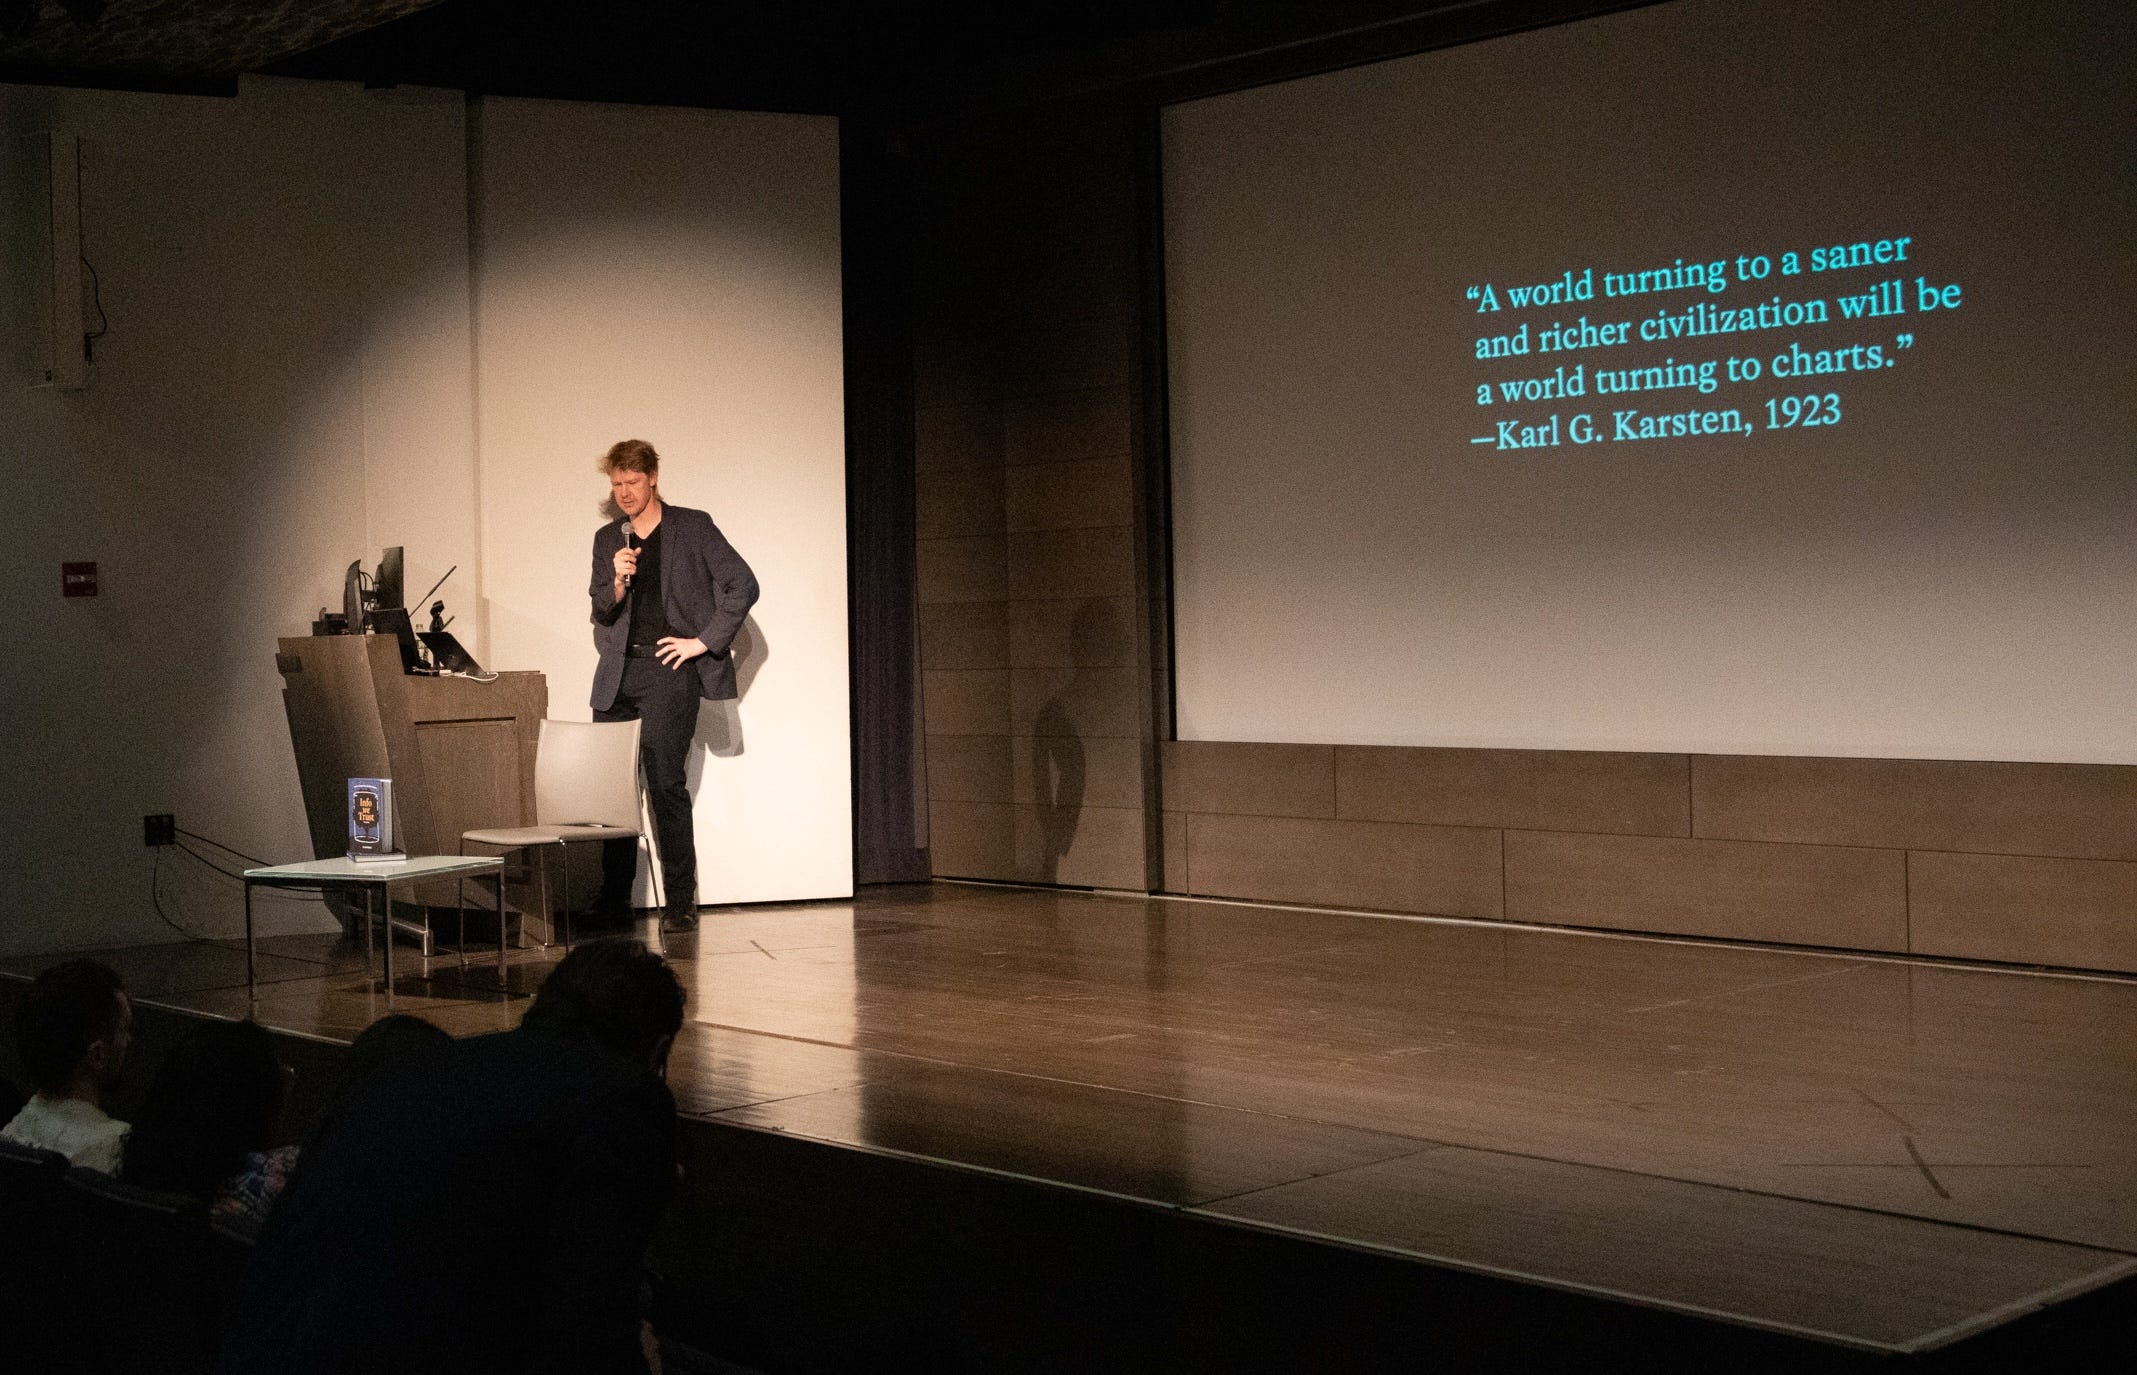
After my presentation, I was asked about tools and gave my stock answer extolling paper and pencil as the most important creative weapon. This quip surprised me with the biggest applause of the night.
Beautiful information graphics off-screen, in the real world, are a real treat. In some sense the show did not feel special to me as much as it felt natural. The best way to consume data might not be alone on a pocket screen—but together, in conversation, with human-sized artifacts.
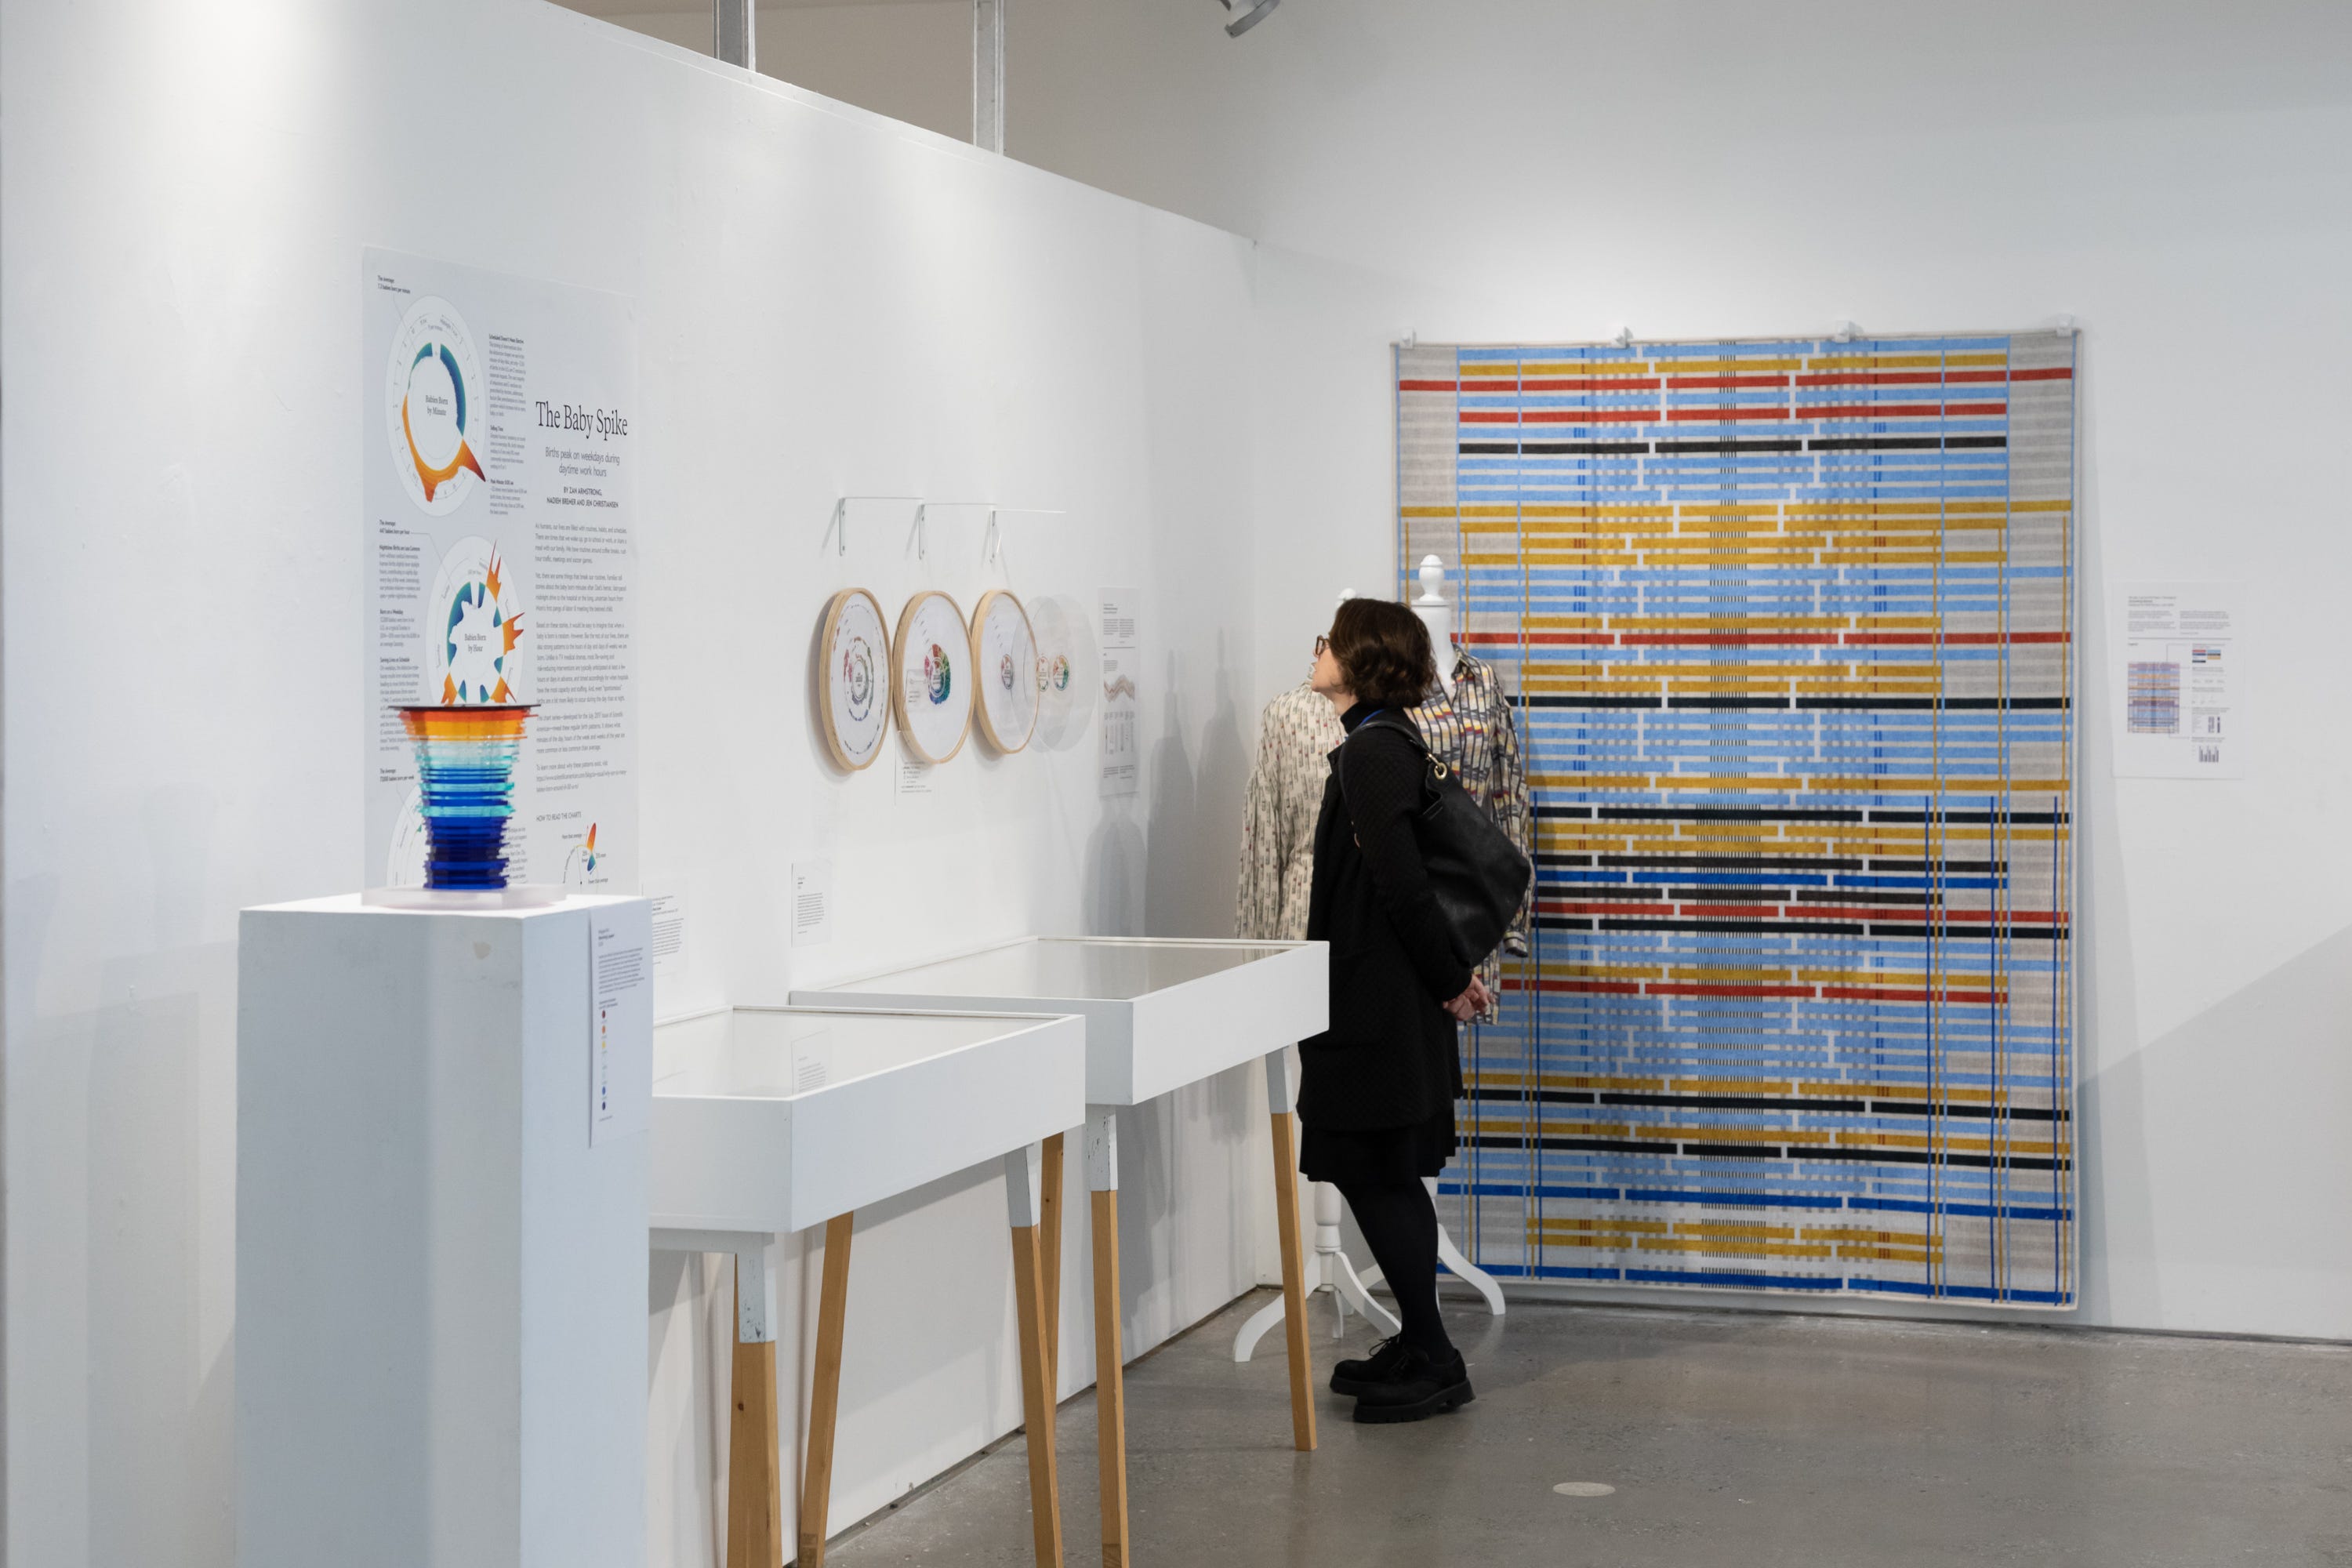
Physical information objects, especially vibrant sculptures, command attention with wonder and excitement. Two such objects were developed especially for the exhibition.
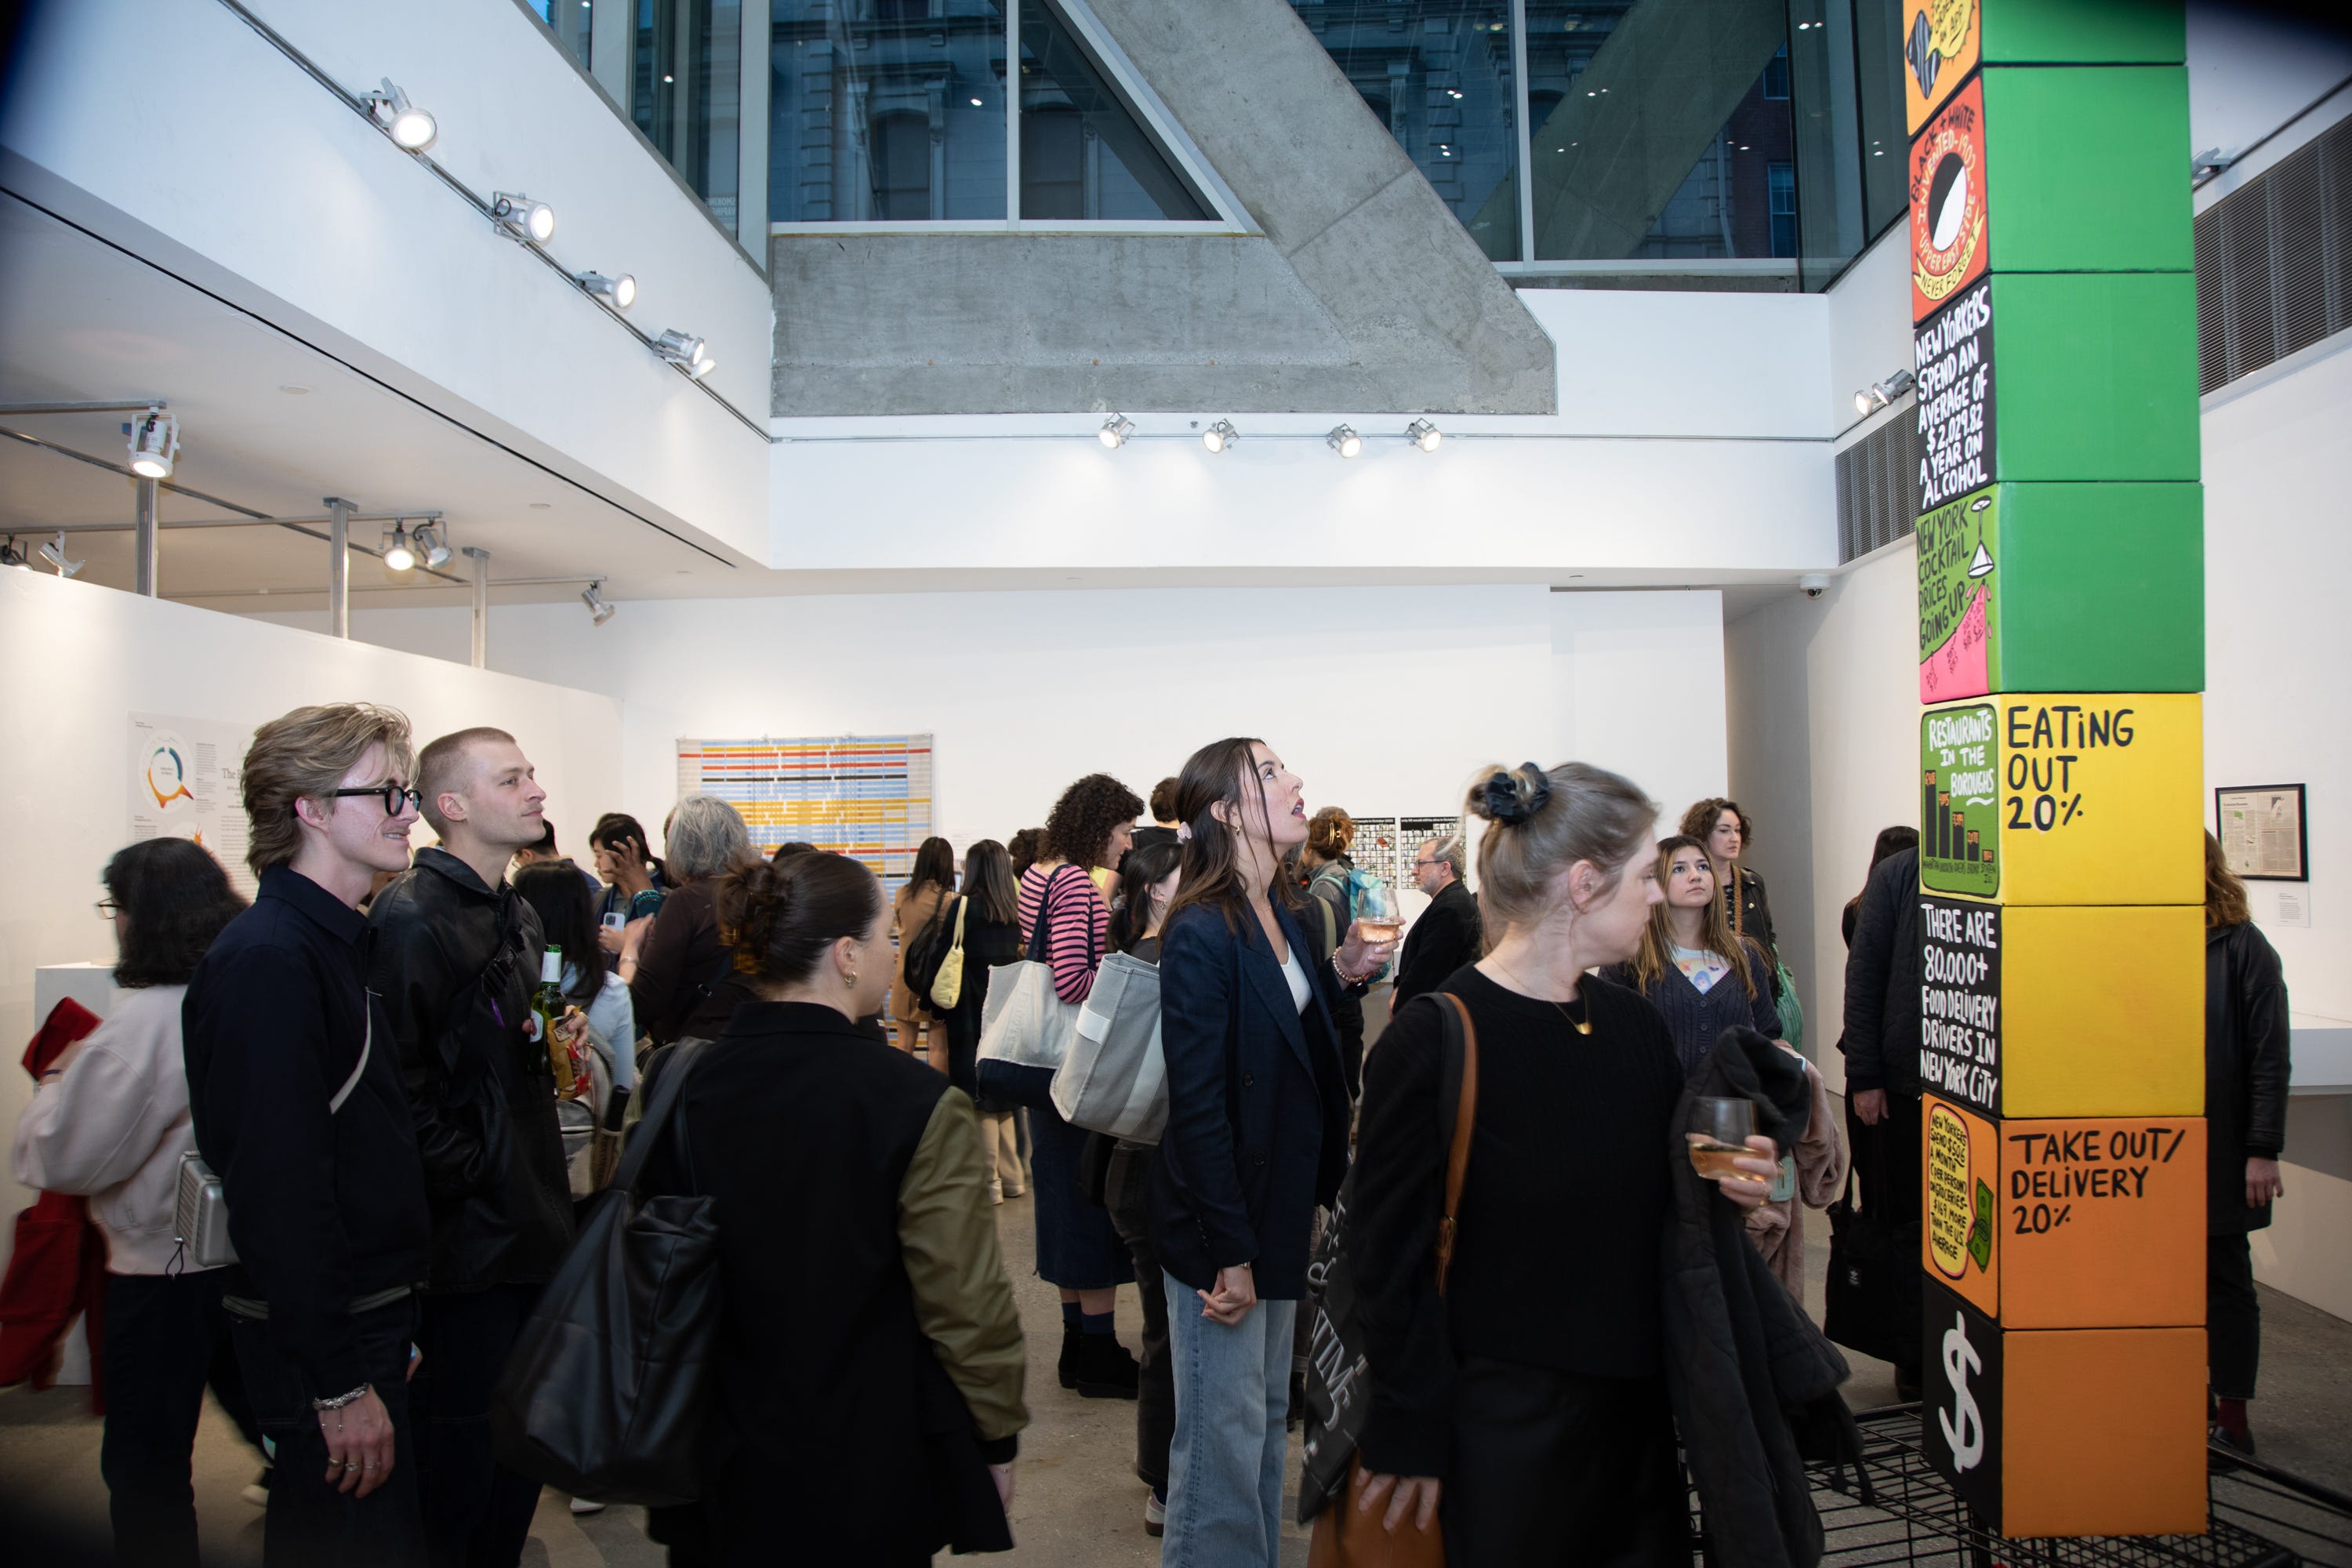
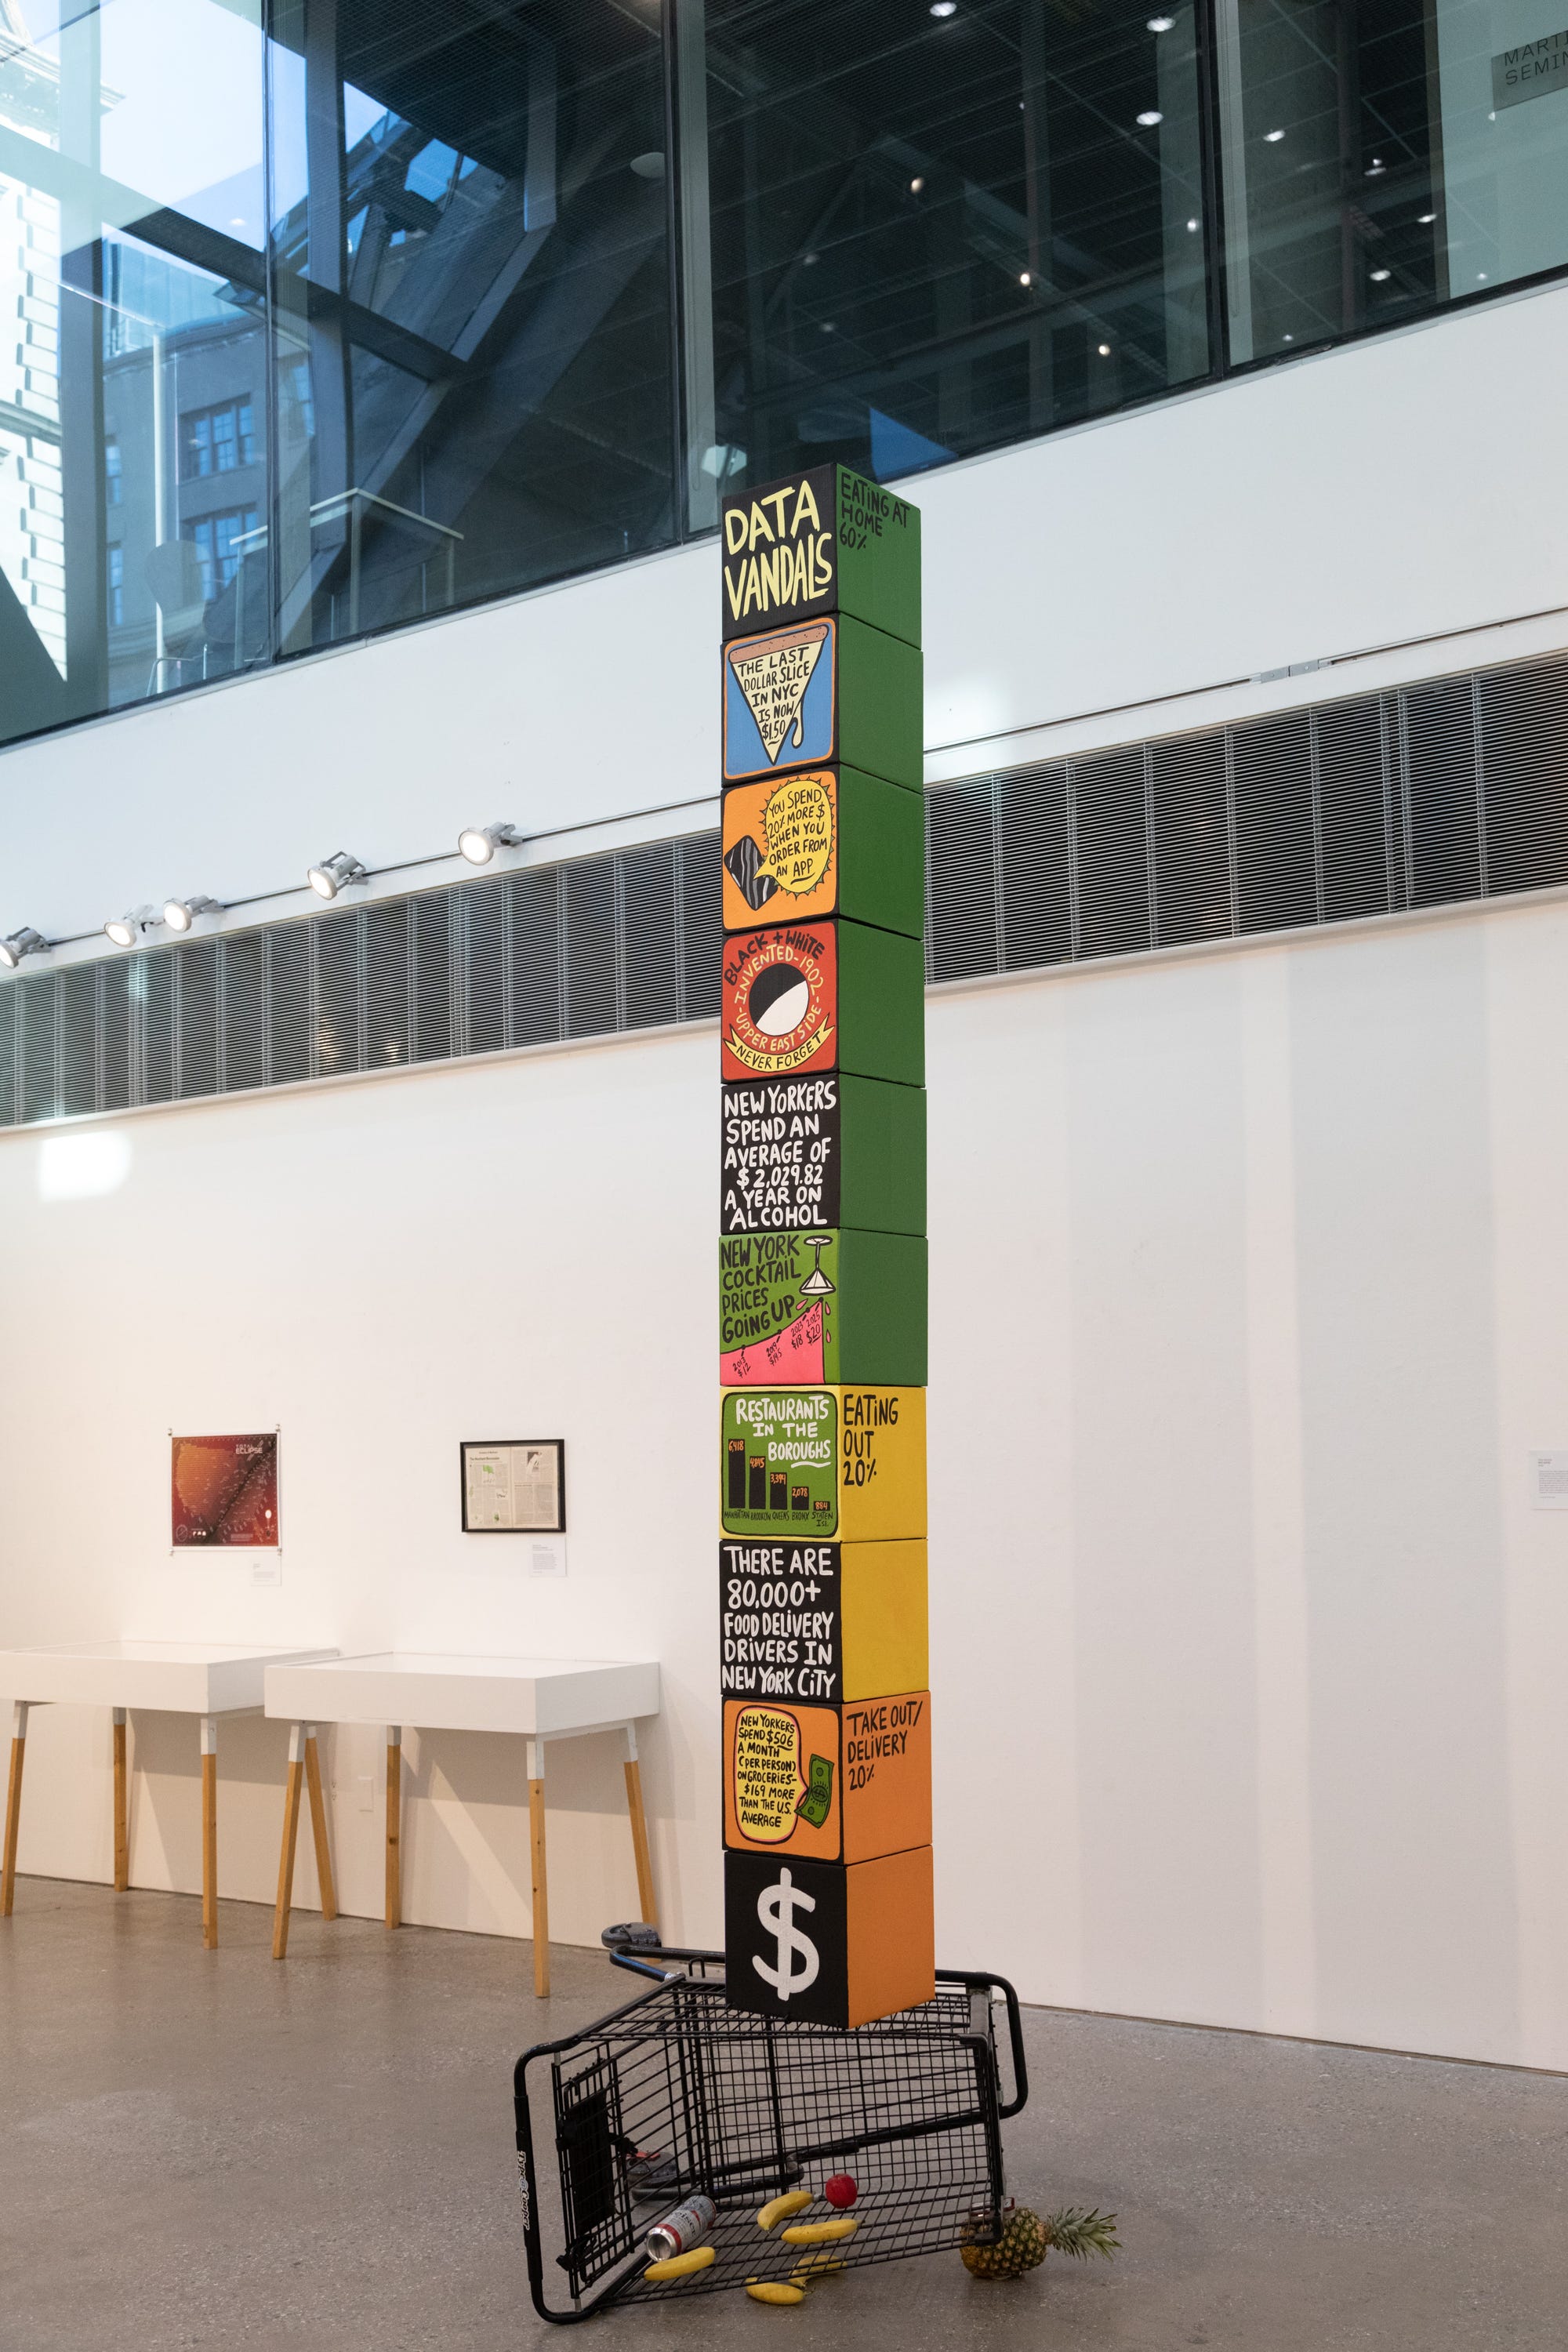
The first, which captured attendee attention the moment they stepped into the gallery, was a 13-foot stacked bar chart by Data Vandals. Teetering high above, each face of their monolith displayed a dimension related to NYC food consumption. Perched atop a shopping cart, its looming threat of tipping over added extra excitement to the room. (We had a close call, but it never toppled.)
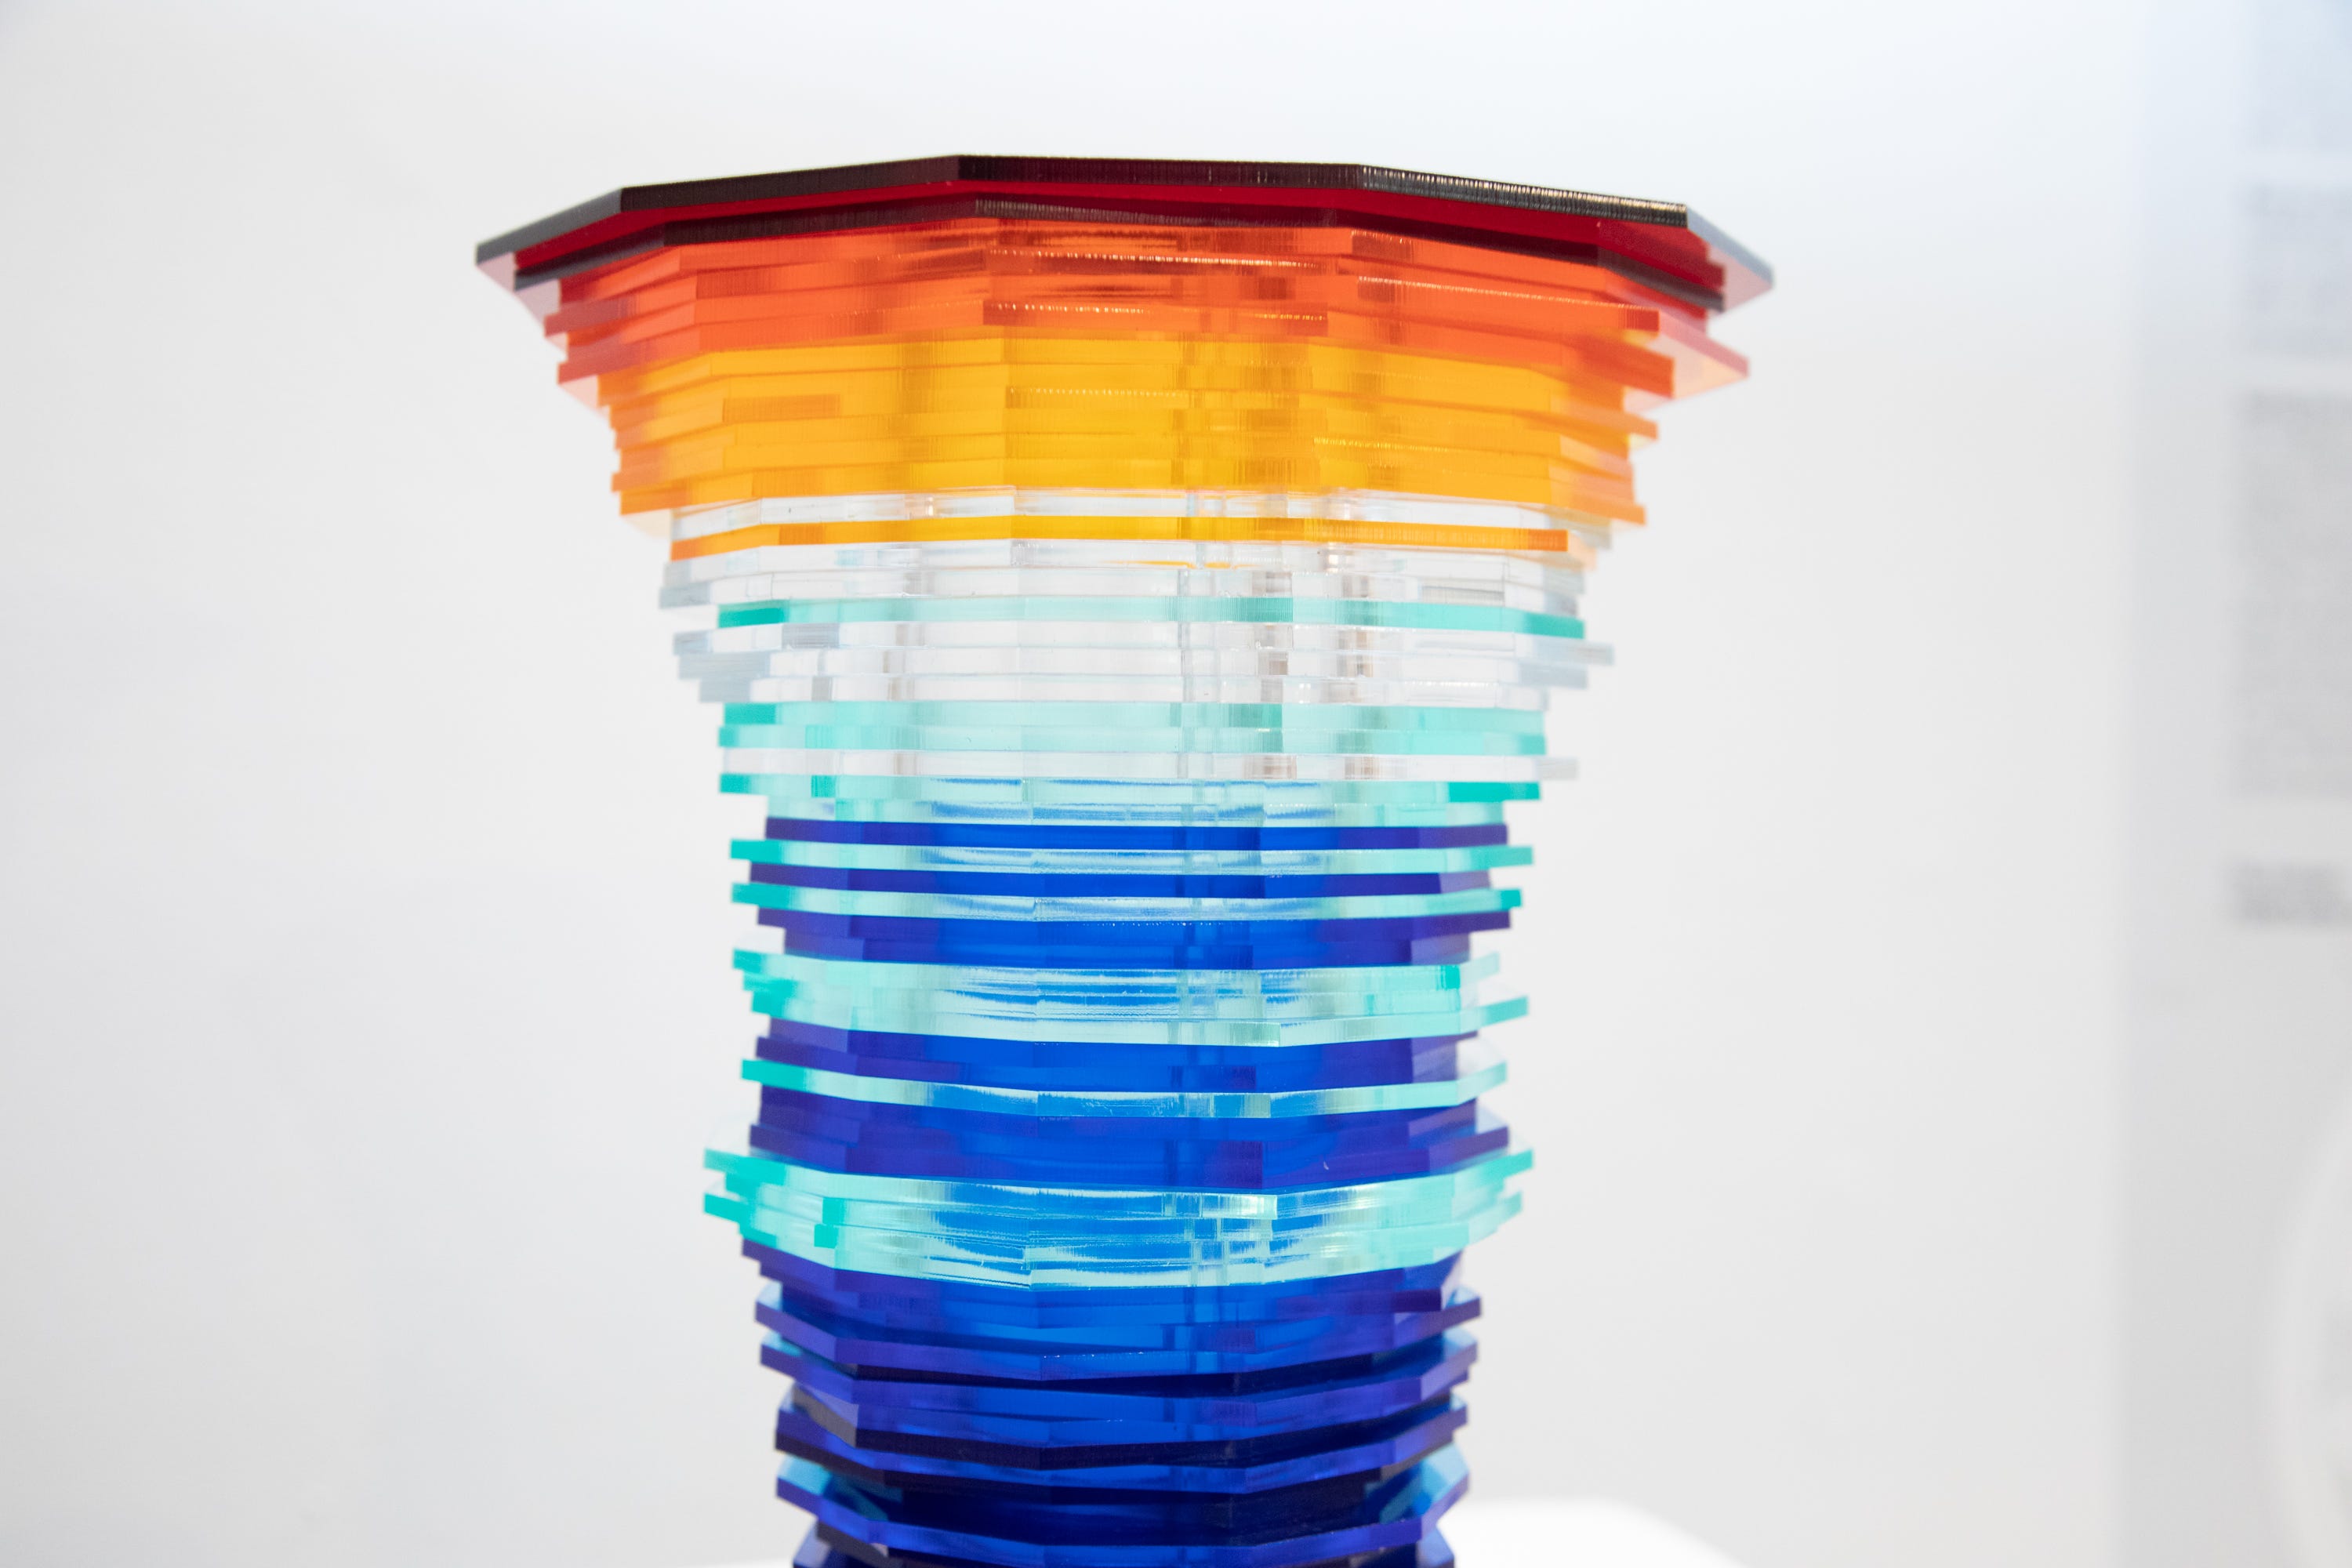
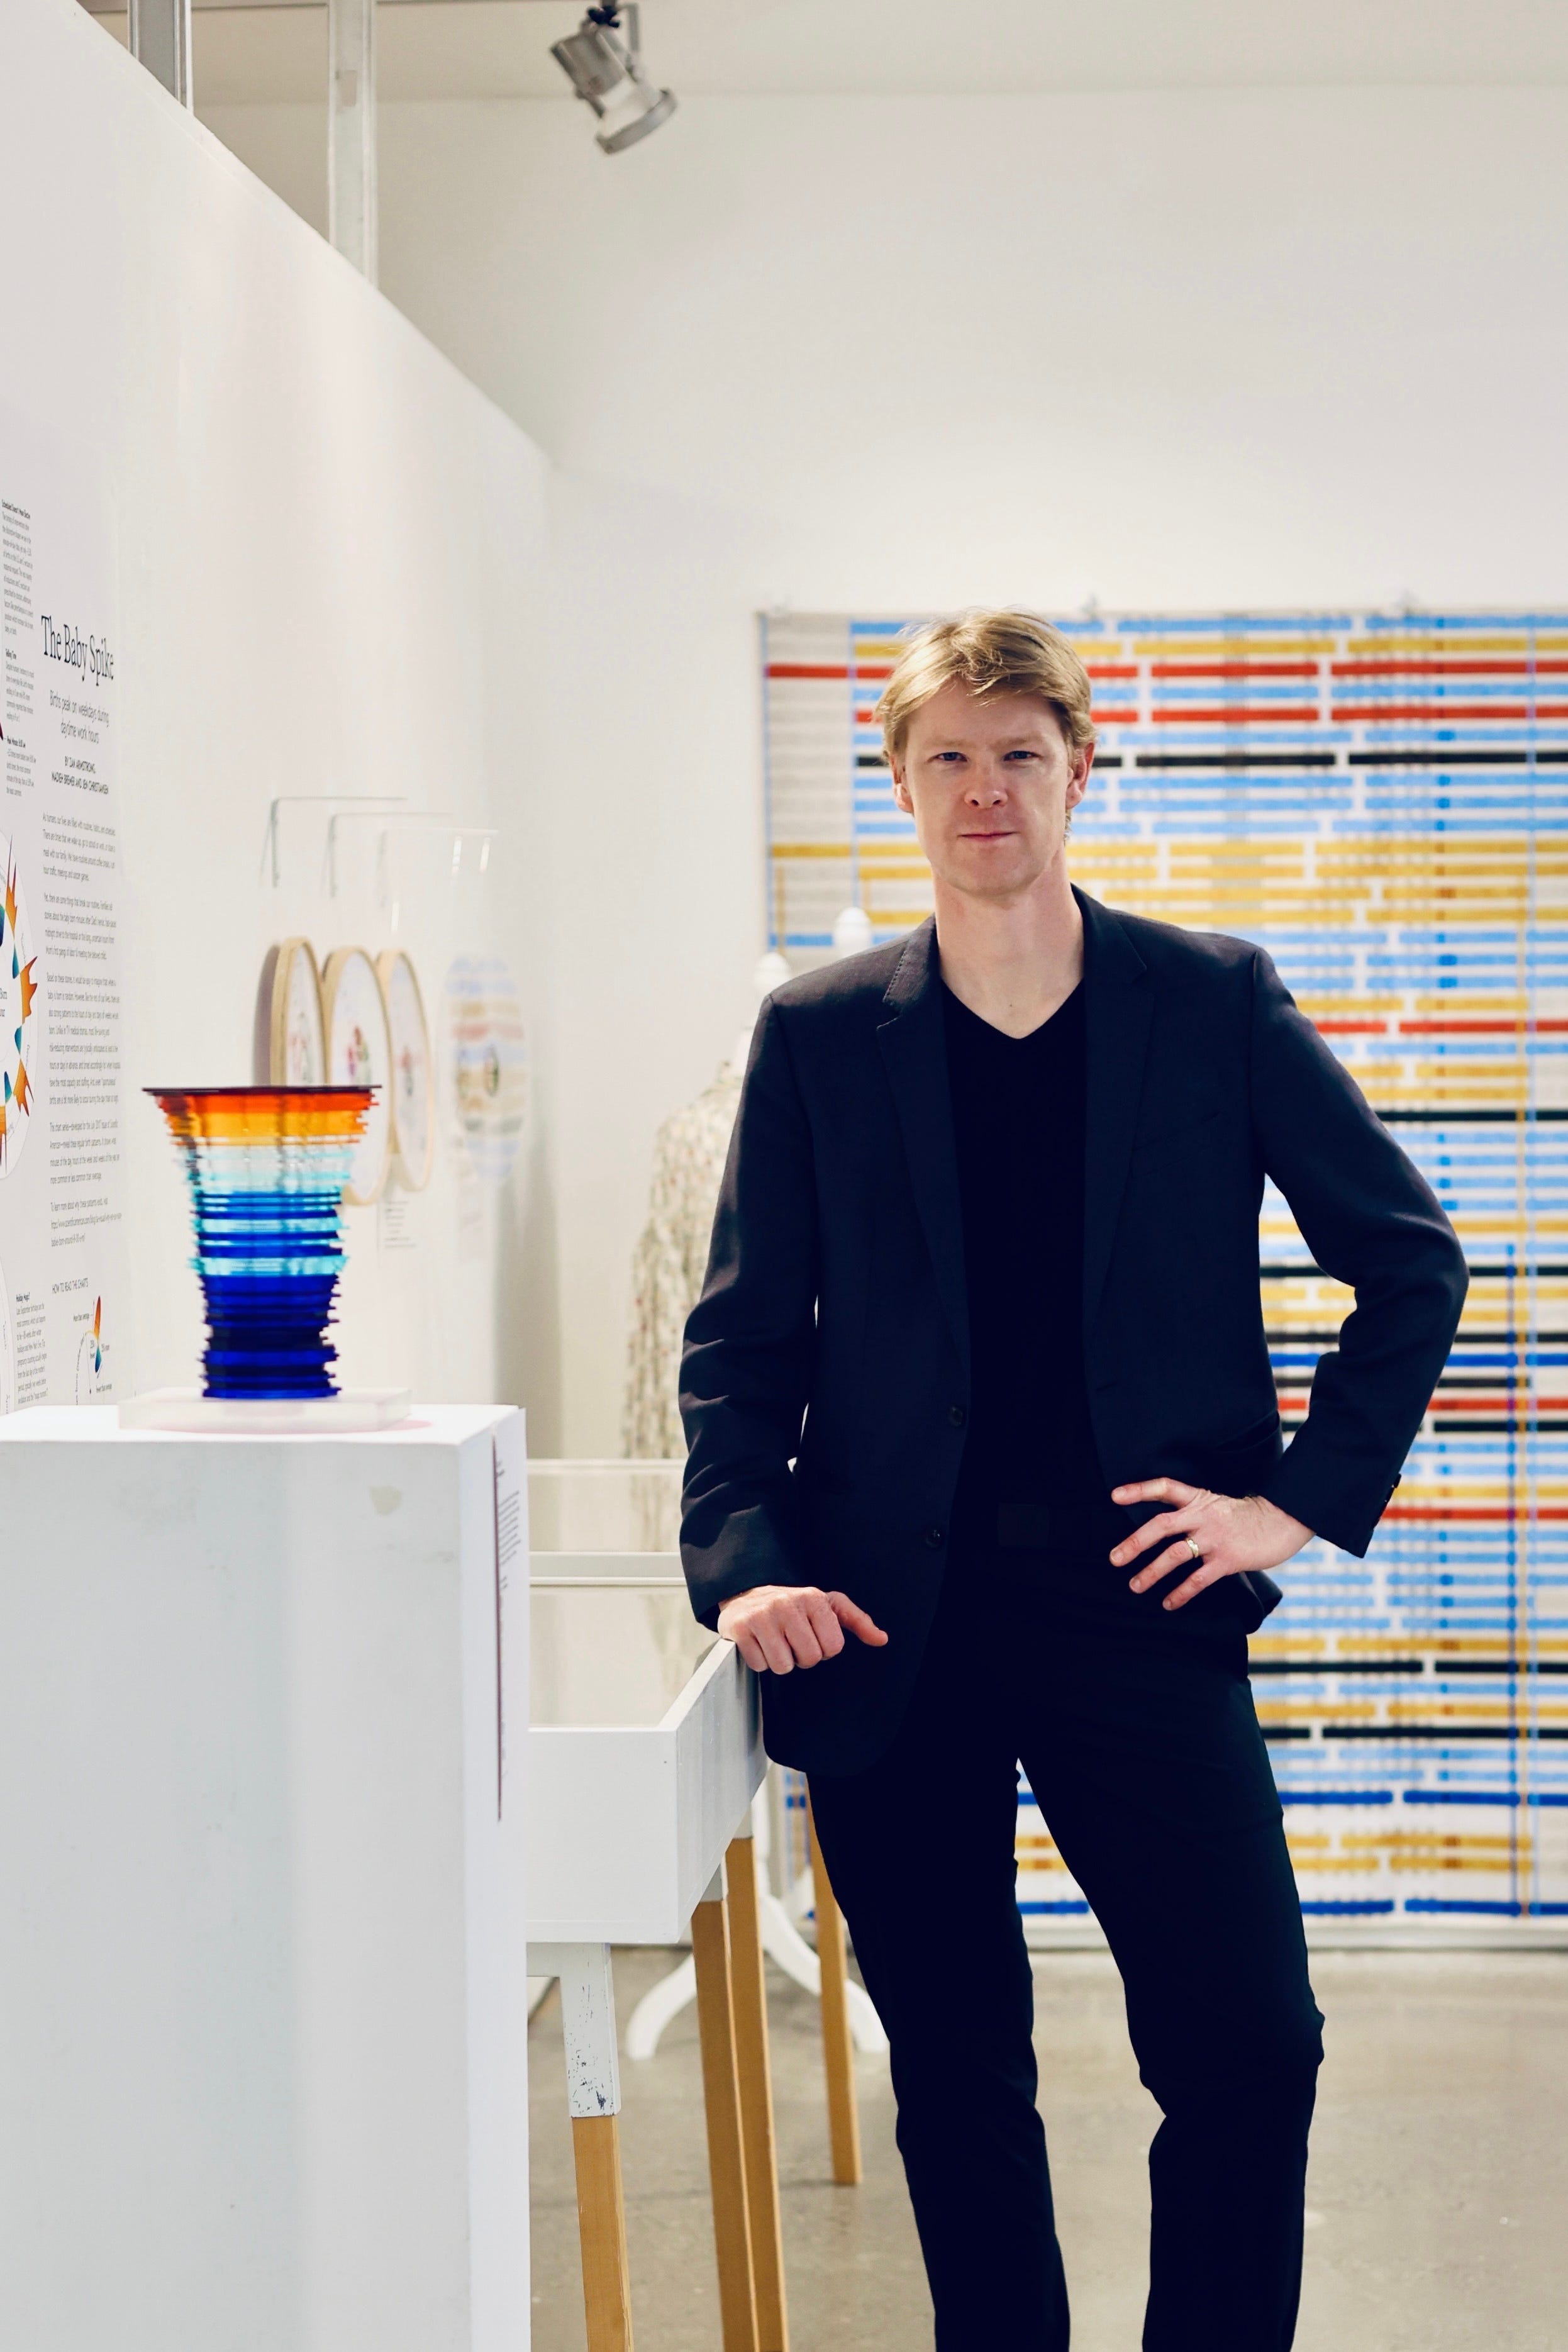
Opposite to that was a smaller but equally dazzling sculpture by Maggie Shi. It portrayed 140 years of warming global temperatures. Her colors came alive under the spotlight, it almost seemed wrong to portray an event so deadly with such a pretty form.
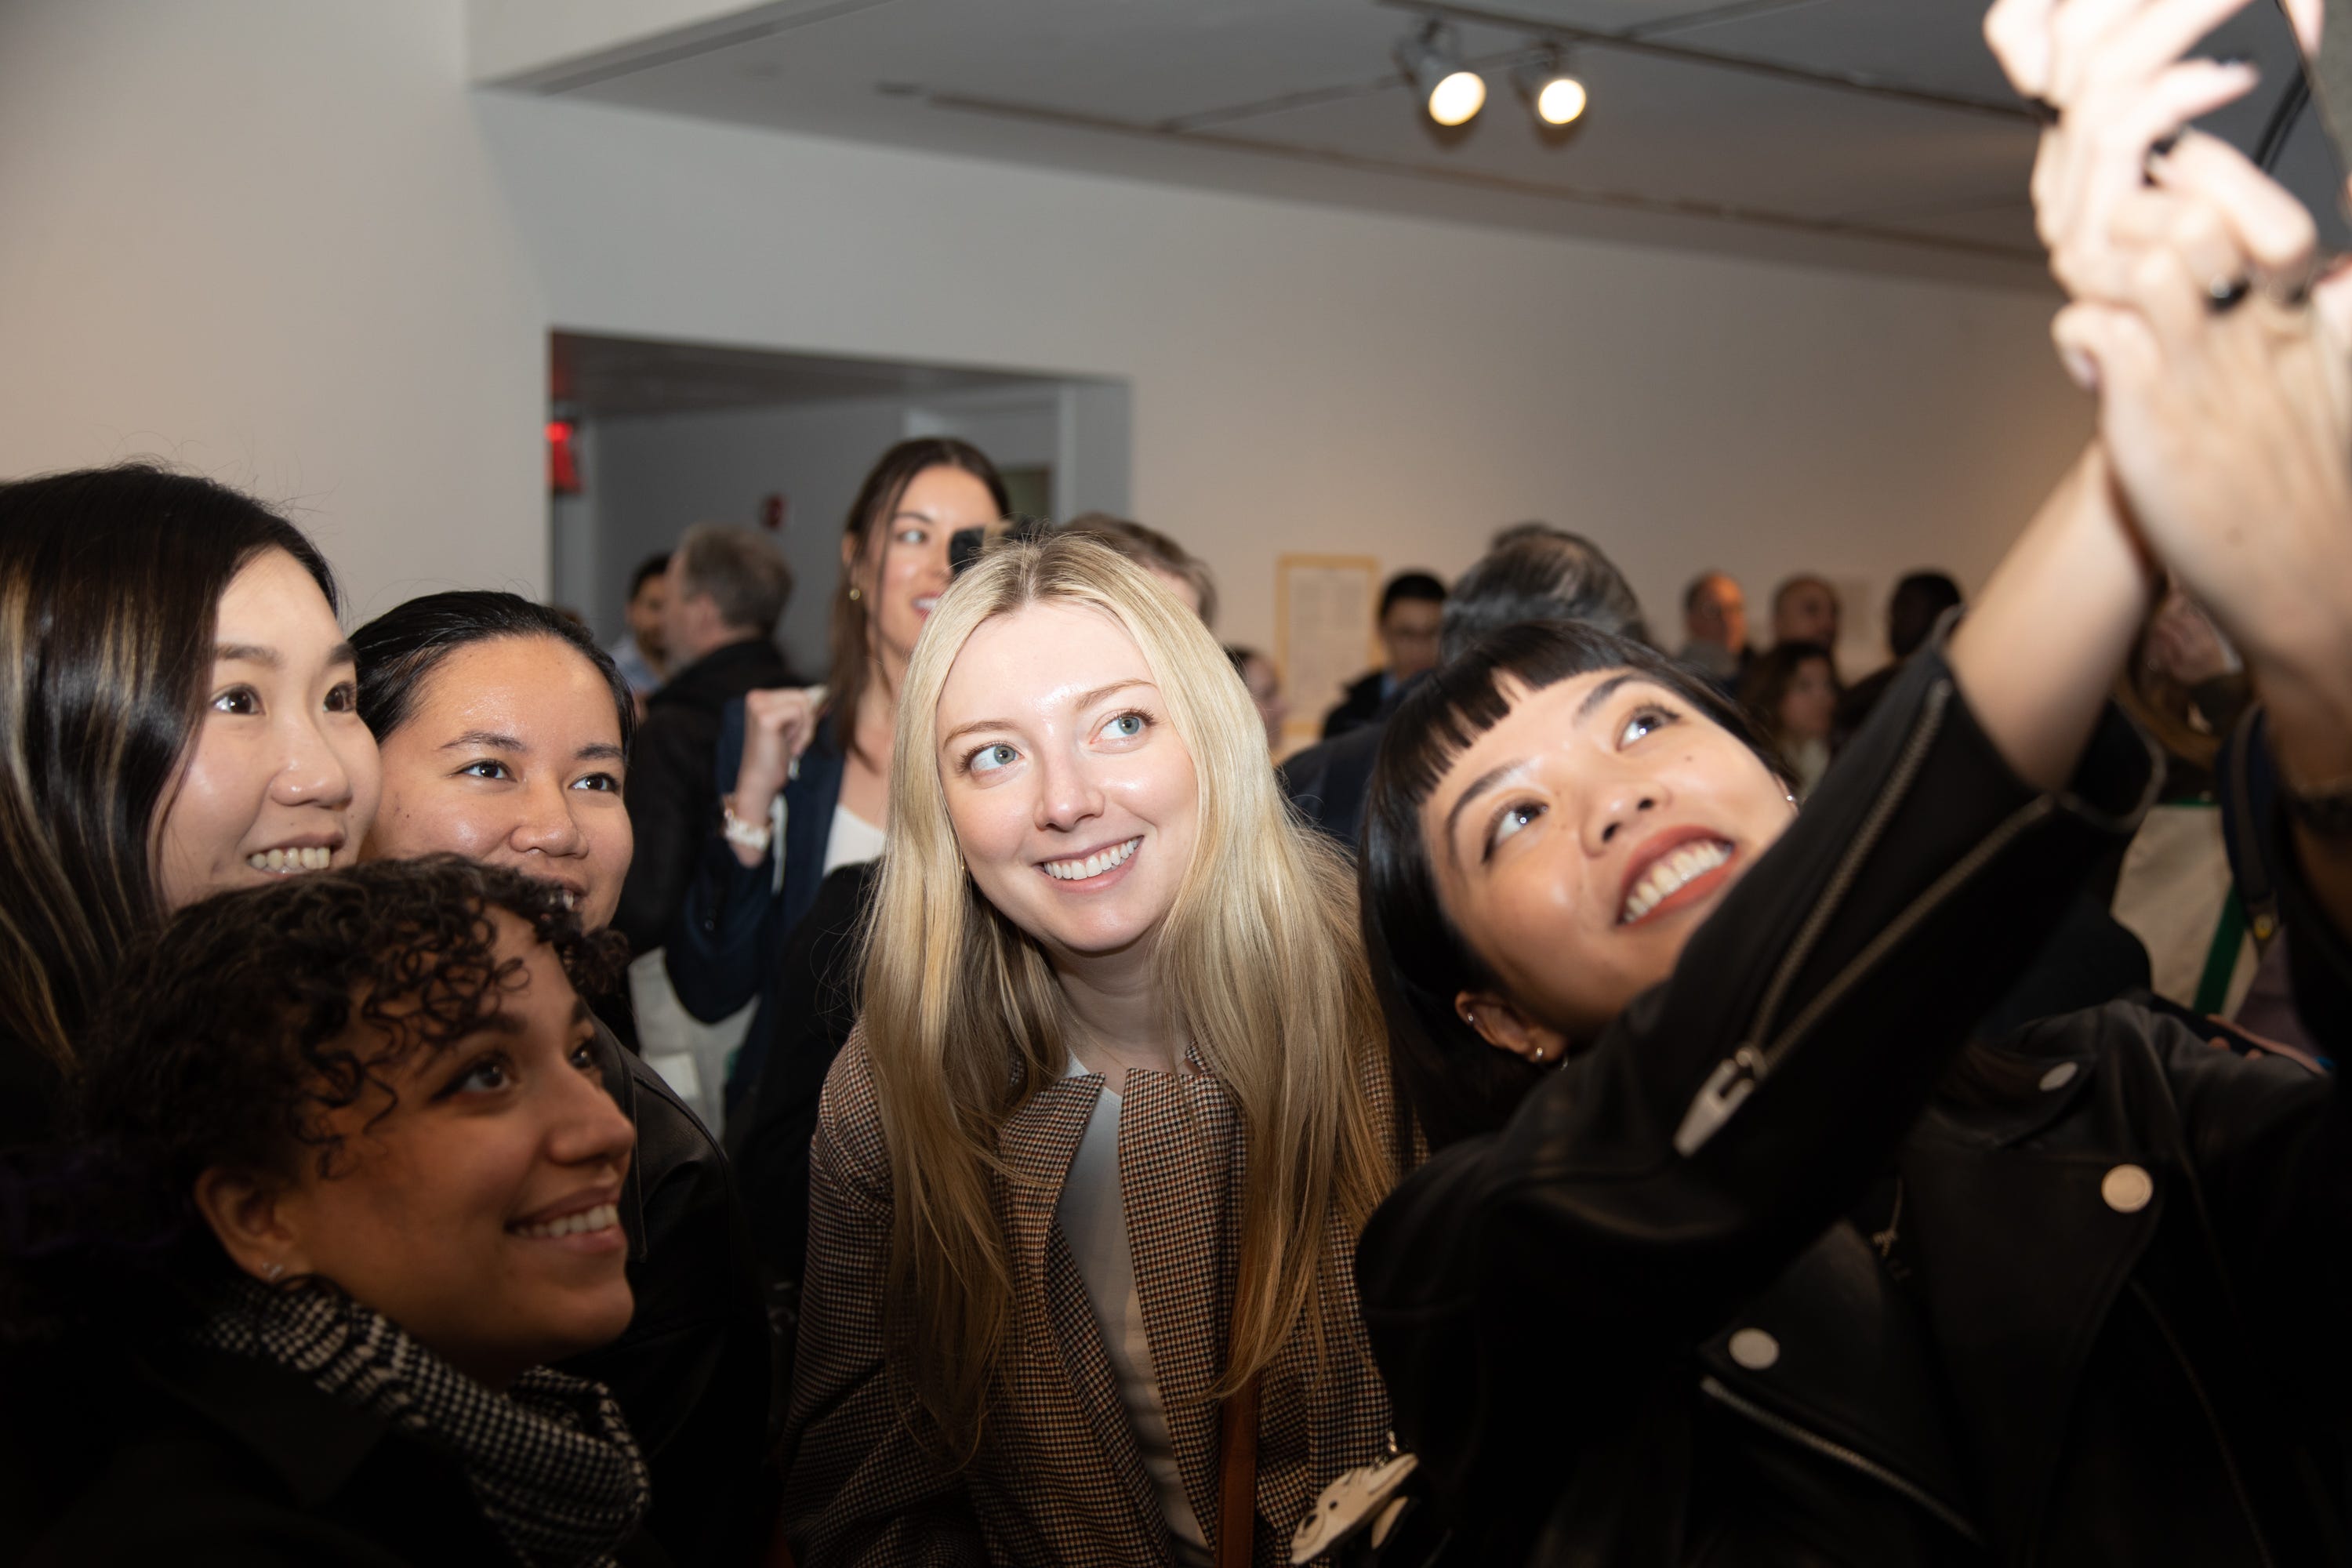
There’s a cultural myth that exhibitions are pure moments of triumph. Looking around, I saw hundreds of enthusiastic New Yorkers crowding each other to get better views of my favorite masterpieces of data graphics—elegantly spotlit in a soaring gallery. It sure looked like victory. But it didn’t feel triumphant.
Why do we feel emptiness after big creative milestones—even the successful ones?
Nearing the end of the experience, I was physically and emotionally exhausted. The week of long days installing, de-installing, keeping track of every detail, being an extrovert, entertaining, etc. wiped me out. New York pushed me to my limit, and maybe a little further. My last obligation done, I jumped in a taxi, cancelled extracurricular plans for the end of my trip, and changed my flight to return early—to rest, reflect, and process the week’s magnitude.
I left New York with a strange mixture of satisfaction and melancholia. Satisfaction that the job was well done—beyond what I thought I could pull off—elevated to a level that nearly intimidated me. So many people gave their artwork or time and resources to make this show happen. It would have been impossible without their contributions.
Books, art, and culture rarely happen without support. In a word: patronage.
But now it was over. I don’t know what is next for Info We Trust, but I know a little more about what I’m capable of.
I learned so much this week. I learned how to design a big gallery exhibition. I learned how to actually mount a show. I learned what it’s like to fund one too, manage the details, and deal with the inevitable disappointments that encroach on a production of this scale—all while having a truly appreciative awareness of the opportunity.
The juice was sweet—was it worth the squeeze? I hope so, but I cannot know today. Sometimes, the value of a moment reveals itself long after it ends.
It felt odd that so much effort was spent on a one-week exhibition. Would I rather the show run for a month? Certainly. Keeping it open for longer would have given more opportunity for people to see it, and perhaps for some buzz to build around it. However, our brief run achieved many of the same goals as a long engagement: assembling the contributing artwork, throwing a big opening party, recording my presentation, and getting fabulous photos of it all.
I believe there are bigger and more joyful information-graphic exhibitions in our future. I know they are possible because past generations made spectacular shows at institutions like MoMA and Centre Pompidou. Why can’t we?
I used to encourage people to make great charts. Now I ask them to make great charts together.
There are more cards to play in the ongoing game of data graphics—work that reveals, connects, and inspires. I’m glad you’re at the table.
Onward!
—RJ
Notes
Some photos in this newsletter by Marget Long
For an exhibition catalog see this PDF
Watch RJ’s opening presentation on YouTube
Hear about future Cooper Union events
Purchase your copy of Info We Trust at Visionary Press or Amazon
About
RJ Andrews helps organizations solve high-stakes problems by using visual metaphors and information graphics: charts, diagrams, and maps. His passion is studying the history of information graphics to discover design insights. See more at infoWeTrust.com.
RJ’s book, Info We Trust, is currently out now! He published Information Graphic Visionaries, a book series celebrating three spectacular data visualization creators in 2022 with new writing, complete visual catalogs, and discoveries never seen by the public.
Congratulations!