
"Stripped of Verbal Sham—Vivid, Unescapable"
Henry D. Hubbard's 1939 foreward to Graphic Presentation.

Welcome to Chartography.net — insights and delights from the world of data storytelling.
This summer, we are republishing a series of historic writing about information design. It is the SUMMER OF CLARITY! These essay inspired the blue marginalia in my new book Info We Trust ($39 from Visionary Press).
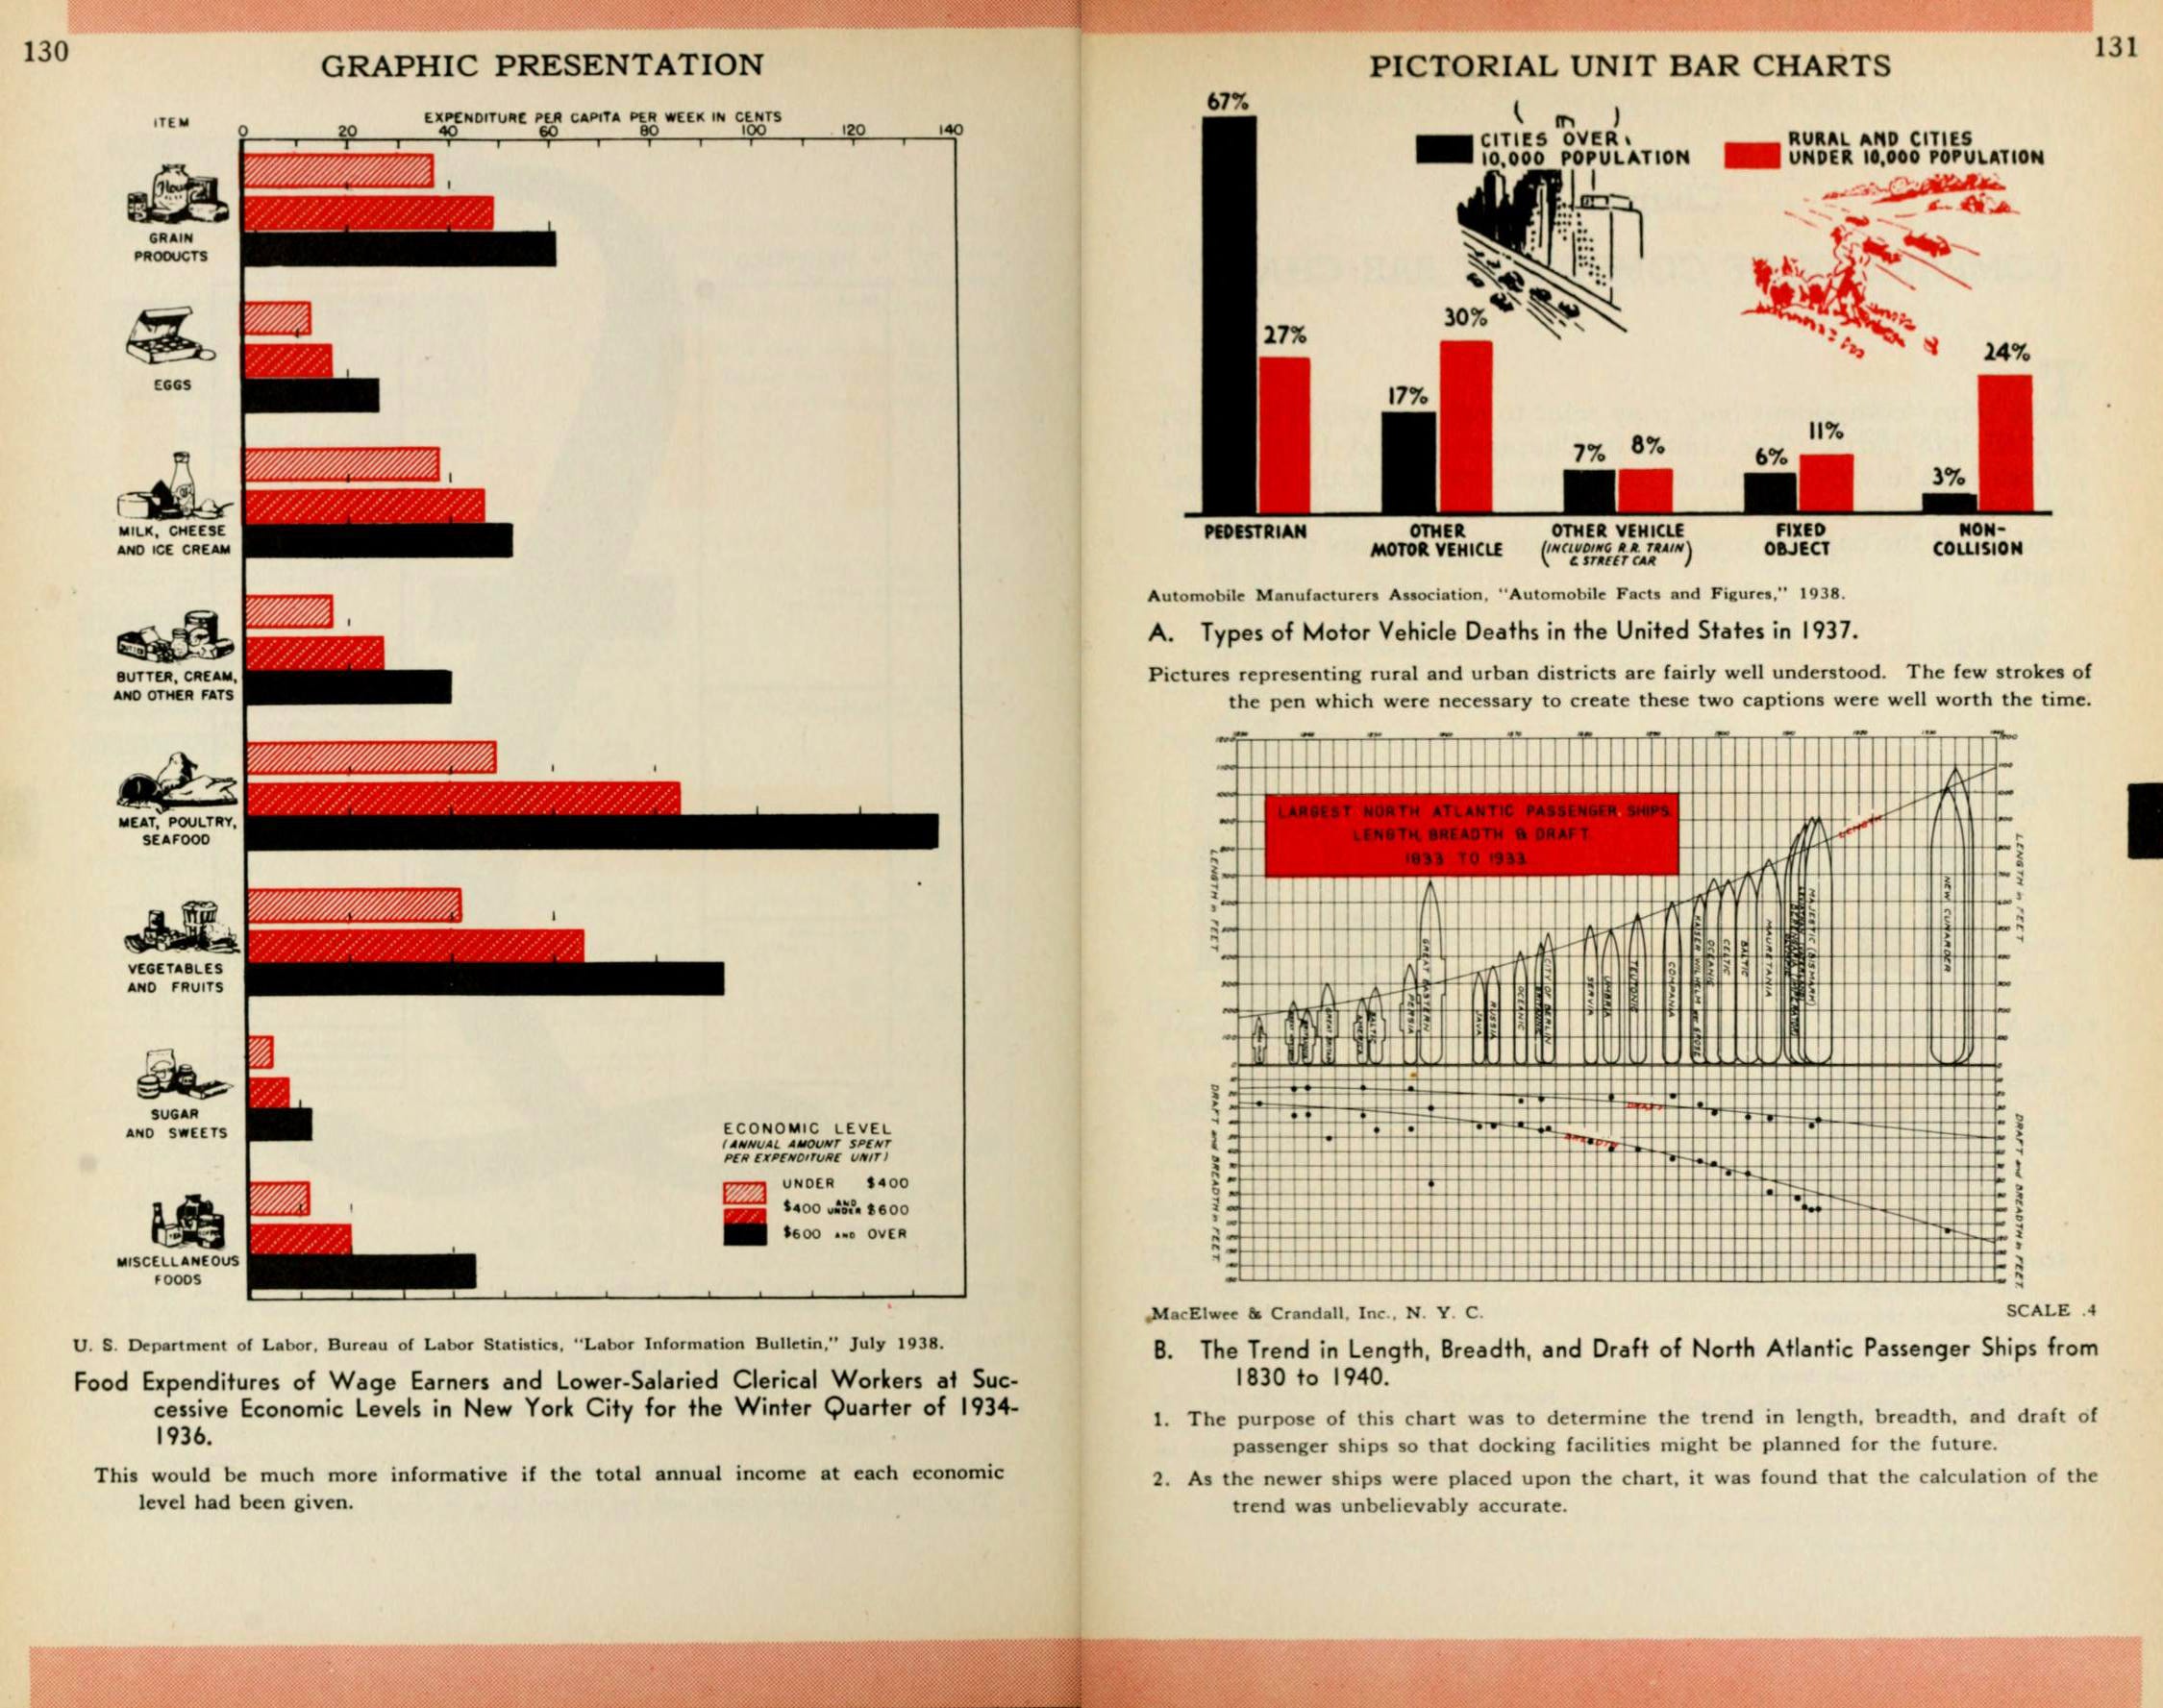
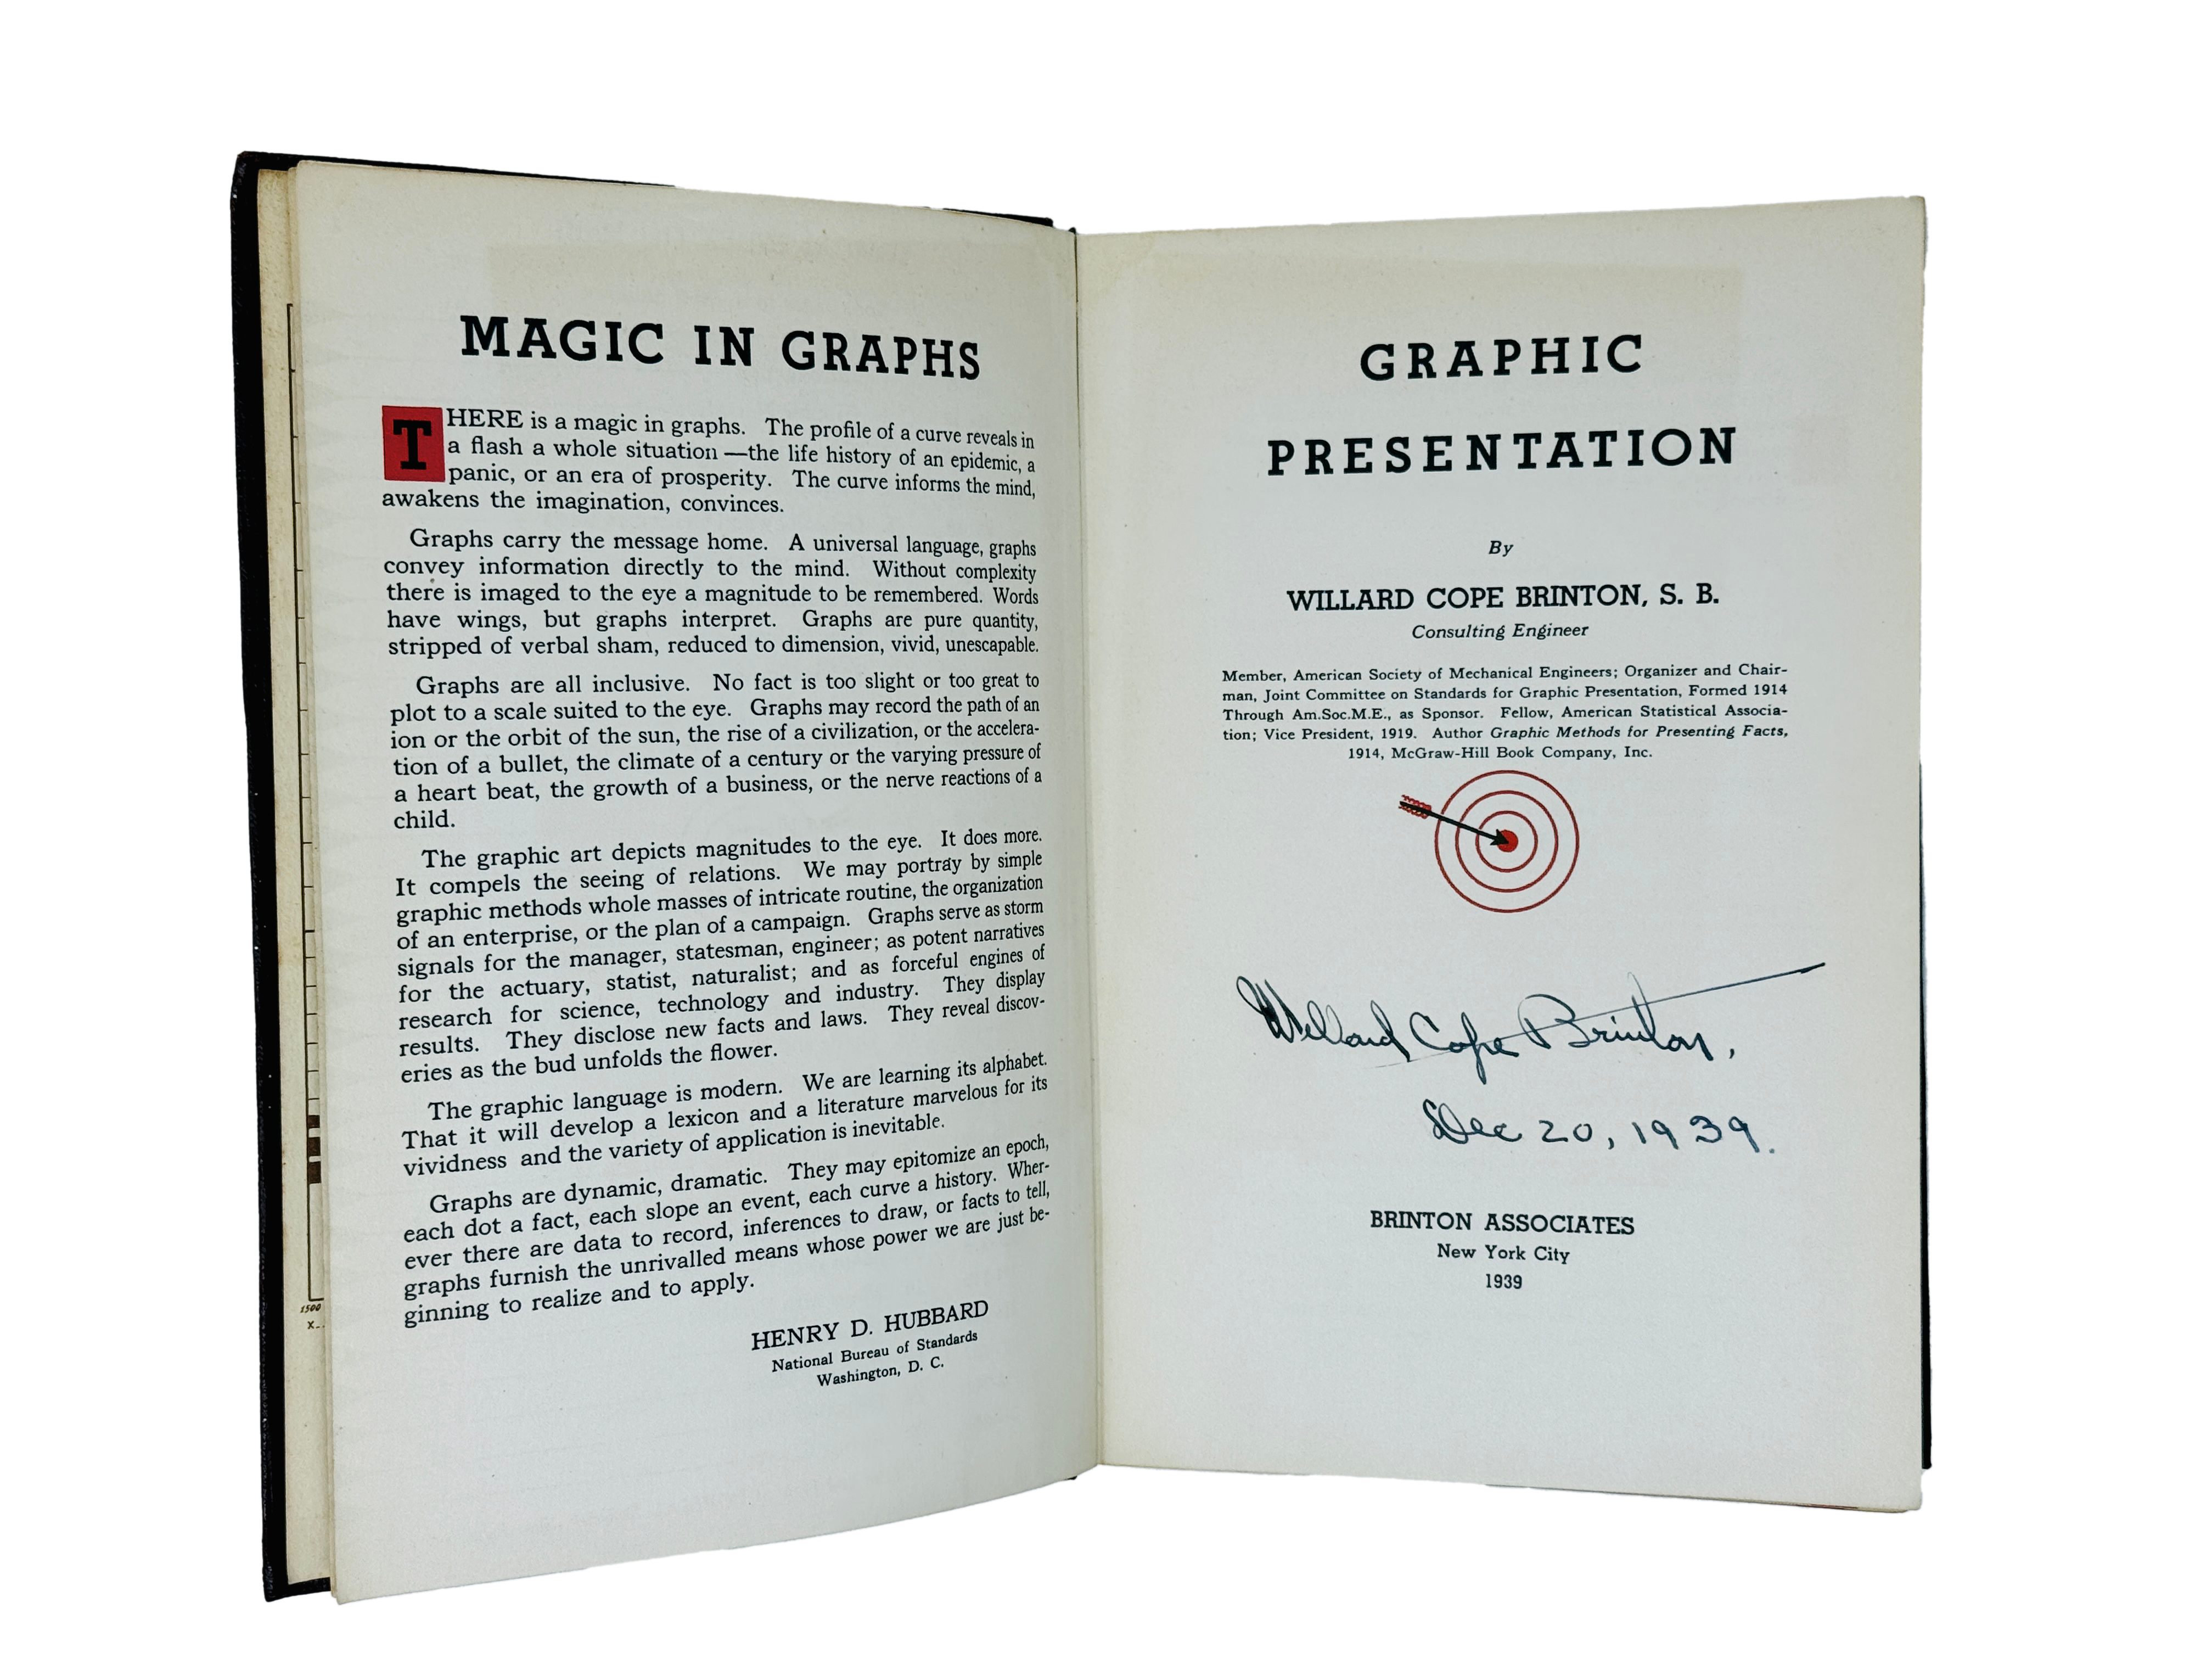
Today, enjoy Henry D. Hubbard’s enthusiastic foreword to Brinton’s Graphic Presentation (1939). Hubbard’s short text is augmented with two spreads from Brinton’s book.

Magic in Graphs
There is a magic in graphs. The profile of a curve reveals in a flash a whole situation —the life history of an epidemic, a panic, or an era of prosperity. The curve informs the mind, awakens the imagination, convinces.
Graphs carry the message home. A universal language, graphs convey information directly to the mind. Without complexity there is imaged to the eye a magnitude to be remembered. Words have wings, but graphs interpret. Graphs are pure quantity, stripped of verbal sham, reduced to dimension, vivid, unescapable.

Graphs are all inclusive. No fact is too slight or too great to plot to a scale suited to the eye. Graphs may record the path of an ion or the orbit of the sun, the rise of a civilization, or the acceleration of a bullet, the climate of a century or the varying pressure of a heart beat, the growth of a business, or the nerve reactions of a child.
The graphic art depicts magnitudes to the eye. It does more. It compels the seeing of relations. We may portray by simple graphic methods whole masses of intricate routine, the organization of an enterprise, or the plan of a campaign. Graphs serve as storm signals for the manager, statesman, engineer; as potent narratives for the actuary, statist, naturalist; and as forceful engines of research for science, technology and industry. They display results. They disclose new facts and laws. They reveal discoveries as the bud unfolds the flower.
The graphic language is modern. We are learning its alphabet. That it will develop a lexicon and a literature marvelous for its vividness and the variety of application is inevitable.
Graphs are dynamic, dramatic. They may epitomize an epoch, each dot a fact, each slope an event, each curve a history. Wherever there are data to record, inferences to draw, or facts to tell, graphs furnish the unrivaled means whose power we are just beginning to realize and to apply.᠅
Henry D. Hubbard (1870-1943) was a member of the U.S. Bureau of Standards in the 1920s. He modernized Mendeleev's periodic table and produced a 1924 version of the Periodic Table of Elements (called the Periodic Chart of the Atoms) which was distributed to schools and universities.
See Brinton’s original Graphic Presentation: https://archive.org/details/graphicpresentat00brinrich/page/2/mode/2up
Let me know if you have suggested entries for future editions of THE SUMMER OF CLARITY.
About
RJ Andrews helps organizations solve high-stakes problems by using visual metaphors and information graphics: charts, diagrams, and maps. His passion is studying the history of information graphics to discover design insights. See more at infoWeTrust.com.
RJ’s book, Info We Trust, is currently out now! He also published Information Graphic Visionaries, a book series celebrating three spectacular data visualization creators in 2022 with new writing, complete visual catalogs, and discoveries never seen by the public.