Welcome to Chartography: insights and delights from the world of data storytelling.
A whopping 27 of 28 of you requested more frequent “super sundry” editions. So here we go, a new parade of exceptional information-design and more that warrants your attention. As much that will fit in an email.
Fire up you inspiration collecting machine and let’s roll!
Color Design


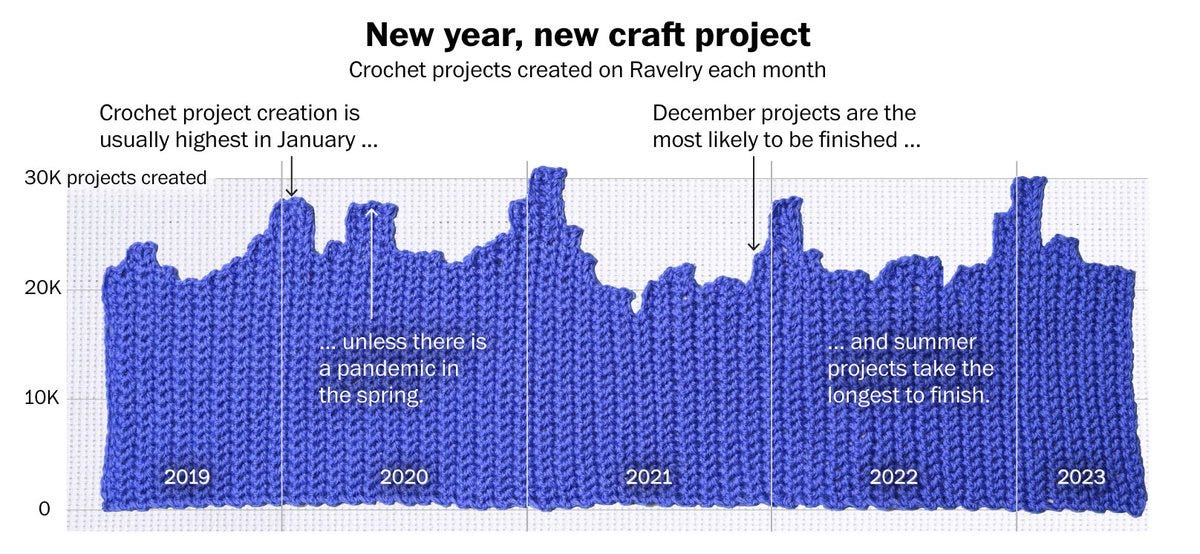
Charts
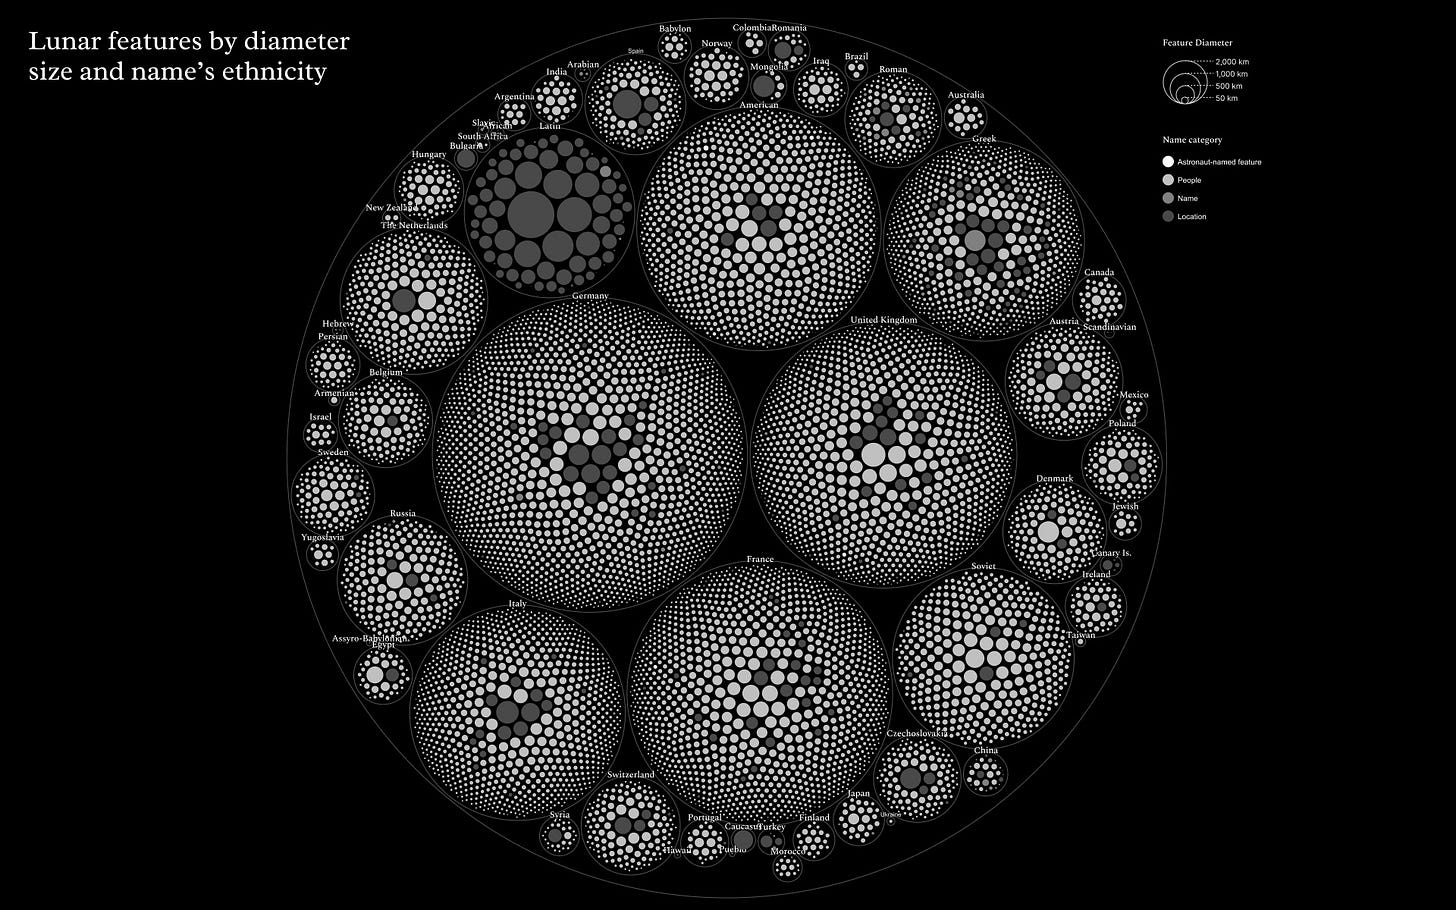


Maps
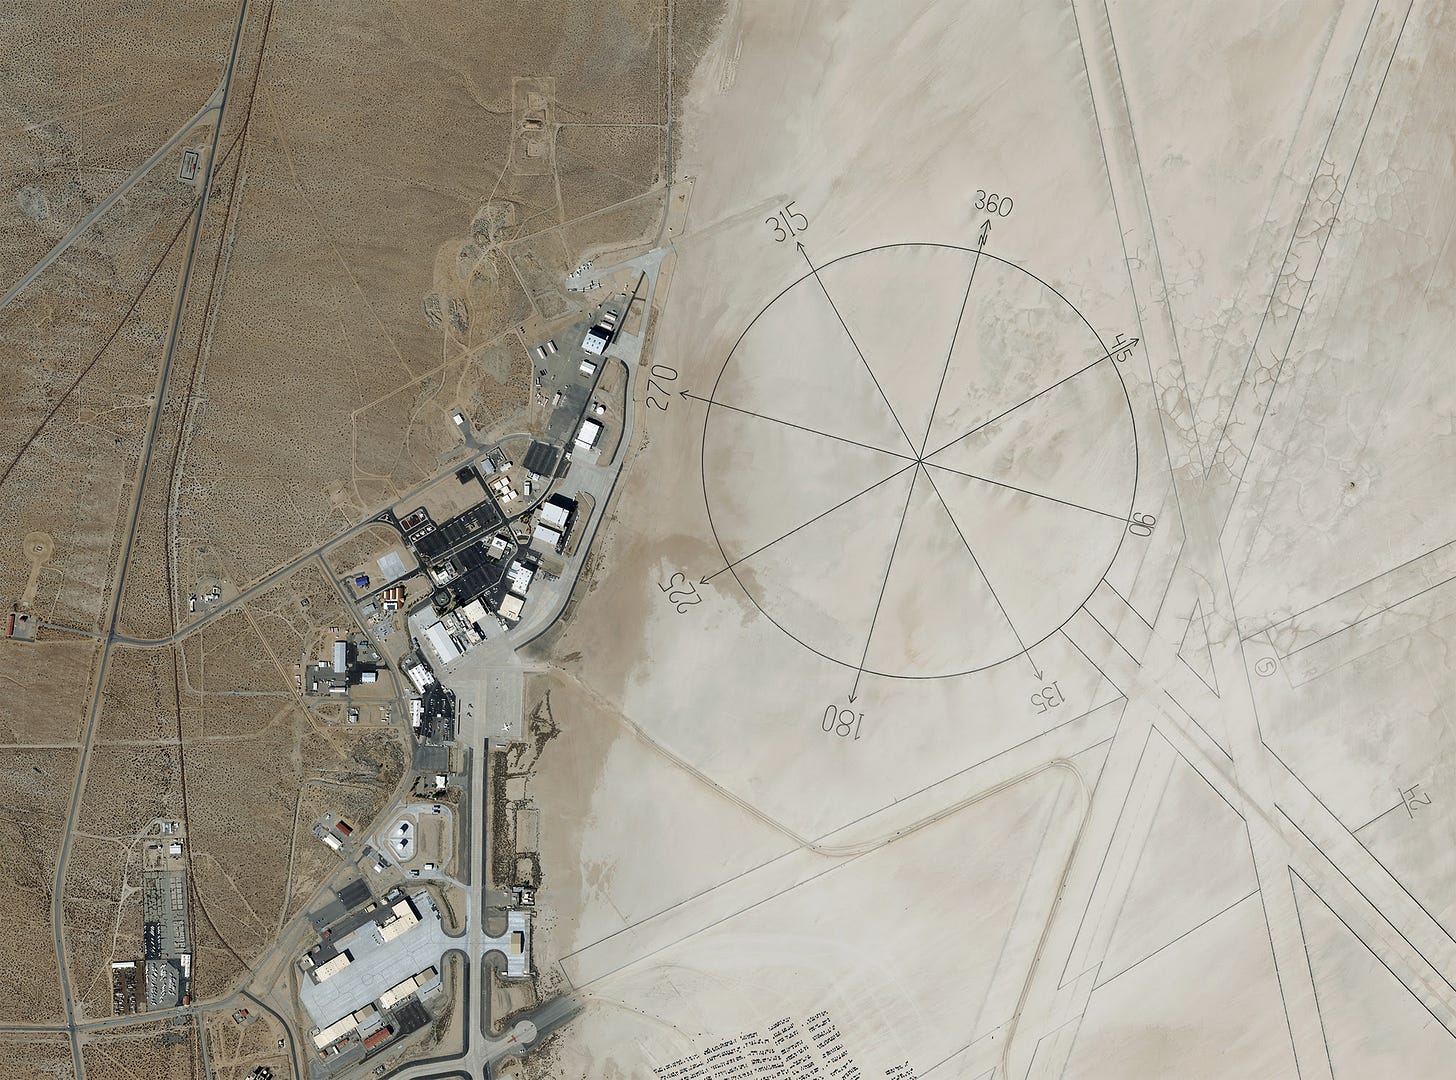
Diagrams

Subscriber Mark Palmer has shared his own musings on analog and digital workblends, inspired by previous issue Analog Dreams.
Have you collected a delicious morsel of information design? Please share it with me to be featured in a future super-sundry edition. Until then.
Onward!—RJ
About
Data storyteller RJ Andrews helps organizations solve high-stakes problems by using visual metaphors and information graphics: charts, diagrams, and maps. His passion is studying the history of information graphics to discover design insights. See more at infoWeTrust.com.
RJ’s recently published series, Information Graphic Visionaries, a new book series celebrating three spectacular data visualization creators. With new writing, complete visual catalogs, and discoveries never seen by the public. His first book is Info We Trust, How to Inspire the World with Data.


