
"The Supreme Rule—Clarity"
Levasseur's show-stopper at the Statistical Society Jubilee.

Welcome to Chartography.net — insights and delights from the world of data storytelling.
This summer, we are republishing a series of historic writing about information design. It is the SUMMER OF CLARITY! These essay inspired the blue marginalia in my new book Info We Trust ($39 from Visionary Press).
Today, enjoy Émile Levasseur’s 1885 address at the Jubilee meeting of London’s Statistical Society, translated from French and augmented with graphics from his presentation.
The Graphic Statistic
I have to talk about the representation of statistical facts by graphic procedures, in other words, graphic statistics, which we can define as "the expression of statistical facts by geometrical procedures". The subject was proposed to me by the London Statistical Society. I accepted. For the past seventeen years, I have been making frequent use of these procedures in my teaching, at the Collége de France, the Conservatoire des Arts et Métiers and the Ecole libre des Sciences politiques; I have often used them to introduce into secondary and even primary education certain notions relating to commercial geography. I am convinced that the use of these procedures is highly beneficial to statistical studies and especially to the popularization of their results, that it is therefore a good idea to spread knowledge of them and to highlight the main applications that can be made of them; and I think, like the board of the London Statistical Society, that the solemnity of this Congress was a favorable opportunity to set out the question.
But don't expect, gentlemen, to hear anything new in this lecture. The subject is well known, and I have no intention of discussing or renewing the theorems on which the construction of graphs is based.
I would have much more to learn from geometers than I could teach them myself on this subject, and, if I were to hazard any demonstration, I would needlessly tire the attention of those who are not geometers.
What I propose to do is to explain the purpose of figures in statistics, to try to classify them and to highlight their usefulness by means of a few examples.
Graphic statistics can be said to be to numerical statistics what action is to narrative in drama. Horace gave actors a rule that we can apply to our subject:-
Segnius irritant animos demissa per aurem
Quam qua sunt oculis subjecta fidelibus.[ From Horace’s c.15 BC Ars Poetica, this passage was translated as “The things which enter by the ear affect the mind more languidly, than such as are submitted to the faithful eyes” by C. Smart and by E. H. Blakeney in 1928.]
And, turning Boileau's verse on its head, we would say to the statisticians:-
" De figures sans nombre égayez votre ouvrage."
[ From Boileau’s c.1674 L'Art poétique, the stanza this passage is from was translated by William Soames as “With Figures numberless his Story grace, And every thing in beauteous Colours trace. At once you may be pleasing, and sublime; I hate a heavy melancholy Rhyme”.]
Numerals, in fact, are abstractions: once the eye has read them, the mind grasps their meaning; but this is only achieved through a series of operations performed by the mind, which perceives each of the numbers in turn, lined up in long columns. Figures, on the other hand, are sensitive forms, images that not only attract and fix the gaze, but enable us to perceive and understand a whole at a glance, making a more vivid, often even deeper and more lasting impression on the mind than numbers. This is a considerable advantage: it's the main raison d'être of graphic statistics.
The latter [images] must not, however, become overly proud of the role it is called upon to play, and delude itself into believing that it is the lead in the play. We must never forget that the leading role belongs to numerical statistics. The person who draws up a statistic counts and adds up units; he classifies them, forms groups which he compares and from which he draws averages; in a word, he acts on numbers; he does the work of a census-taker and a calculator. This is the place to start, and it may even be the best place to stop: it's what statisticians most often do. However, it is worth adding in passing that the science of numbers is not enough, and that if the calculator is not familiar, through knowledge of the legislation, institutions and social state of peoples, with all the details of the subject he is dealing with numerically, he is liable to commit gross errors, while presenting apparently exact operations, and to end up with a mediocre work, often even dangerous because of the illusion of mathematical rigor it produces.
Graphic statistics comes only after the establishment of statistics by numbers; it is only a mode of expression, and therefore a subordinate form. The geometer and the cartographer receive the numerals; their job is to transform them into figures that make their meaning and relationships easier to understand.
[Levasseur proceeds to describe graphic figures, maps, and solids, with many examples across two-dozen pages. Some of these examples are repeated throughout this translation.]
Some statisticians have tried to formulate rules for the construction of graphs and to fix this scientific language to some extent, in the same way that chemical notation has been fixed. Undoubtedly, mathematicians have to determine the geometric procedures best suited to the figurative expression of numbers; but they don't have to impose specific types of representation. This is a matter for classification, as we have tried to do, rather than regulation. Any graphic that does not shed light on the subject is condemned: this is the supreme rule, which is none other than that of clarity.
As we have said, therefore, you must not put too many curves on a diagram, or too many different things on a map, and you must arrange what you do put there in such a way that the eye first grasps the whole clearly, and the mind then penetrates effortlessly to the notion of the details. These are the main rules applicable to demonstration, which is the most common purpose of drawing a chart.
But that's not the only purpose it can serve. The graph is also an instrument of invention, not only in the natural sciences, when it functions as a recorder, but even in statistical studies, when it is merely the reproduction of known data. By comparing the curves of several facts plotted on the same diagram, the statistician, the economist and the moralist often discover, in the similarity or opposition of movements, certain relationships that had escaped them, others whose intensity or periodicity they would otherwise have found difficult to appreciate. This is how the relationships between circulation, cash and issuance in a bank become clear. When we are in the habit of using curves to represent a country's economic phenomena relating to production, circulation, finance and demographics, as we often do in our teaching, we are struck by the resemblance that manifests itself in the rise or fall of the greatest number of curves, and we are led to conclude that the economic life of a nation results from an organism whose every part and every manifestation is interdependent. For invention charts, it is even less appropriate to give advice on execution than for demonstration charts. The researcher is the sole judge of the procedures he believes to be best suited to his mind and most likely to lead him to his goal; the important thing, in this case, is not that the author be judged clear, since he is not speaking to others, but that he understand himself. If there's a recommendation to be made, it's to avoid the all-too-common error of mistaking a simple coincidence of phenomena for a relationship of cause and effect; and this recommendation is addressed not to the construction of the graph, but to the conclusions drawn from it.
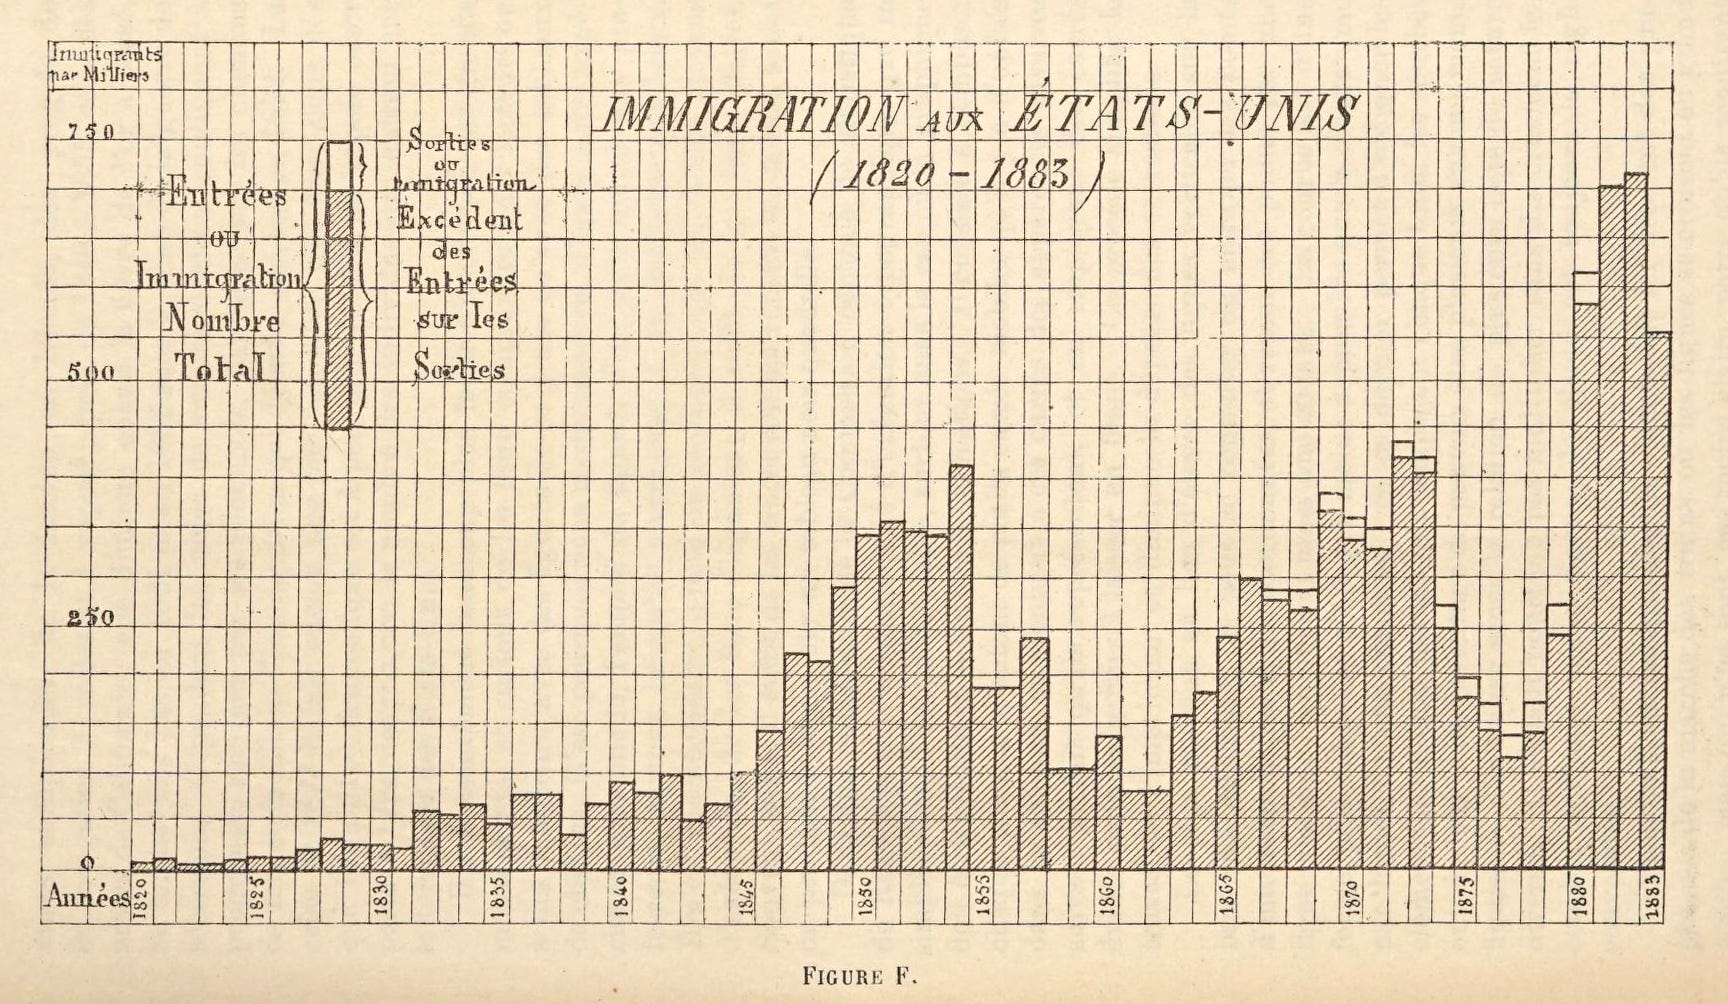
Invention with the help of graphs can extend beyond observed facts to certain predictions of the future. Indeed, if two series of observed phenomena result in two curves of mathematical regularity, we can assume that, for some time to come, these phenomena will continue to occur in the same way, and we seem authorized to continue the curves geometrically and then draw some inductions from the way they behave in relation to each other. Monsieur Cheysson gave a theory of the construction of curves of this kind at the Paris statistical congress, which can be useful for the study of certain political economy problems. However, they should only be used with great caution, because trying to apply the rigorous procedures of the mathematical sciences to the moral sciences almost always leads to disappointment.
Graphics can also be an instrument of control. When figures are lined up in columns, it's not always easy to judge whether they agree. When they are transformed into graphs, the slightest irregularities in the drawing are obvious: all that's left to do is find out whether the anomaly is the result of a real change in the intensity of the phenomenon, or a statistical error. For example, Mr. Bodio has highlighted the inaccuracy of age declarations in headcounts, showing that there was always an excess for round numbers, 20, 30, 40, etc., and that this was due to a lack of precision. We ourselves often have occasion to demonstrate errors of the same kind in our demography course, for example, when we draw up the pyramid of the French population by age, and point out the considerable protrusion on the women's side of the seats representing ages from 20 to 25, next to the dip that occurs in the seats from 25 to 30: women, it seems, don't like to declare that they are over twenty-five. They certainly don't suspect that the indiscretion of the graph betrays their secret.
Whether applied to invention, control or demonstration, graphic statistics cannot be too strongly recommended to scientists who study phenomena in their offices, to writers and professors who publicize them and explain their laws in their books or lessons, to statistical directors and large private administrations who, when publishing to spread knowledge of certain facts, should not be afraid to use as an auxiliary an effective means of propagating the results of their research. The more work these investigations have cost them, the more they should apply themselves to facilitating the public's understanding of them, by sparing the public some of the trouble they have taken themselves.
Statistics, which only began to play a serious role in our century, has now become necessary for social studies and the government of states. Its importance will continue to grow, despite the criticisms leveled at it, some of which are well-founded and numerous, and stem from its own inadequacy; others, perhaps even more frequent, are due to the ignorance or frivolity of those who consult it. It is important that statisticians support this movement, and that, with a view to the widest possible dissemination of their work, they do not neglect one of the most appropriate instruments for popularizing its results.᠅
P. Émile Levasseur (1828–1911) was a French economist, historian, Professor of geography, history and statistics in the Collège de France, at the Conservatoire national des arts et métiers and at the École Libre des Sciences Politiques. He is known as one of the founders and promoters of the study of commercial geography.
See Levasseur’s original text and additional examples: https://archive.org/details/s4833id1397559/page/218/mode/2up
Let me know if you can help improve this translation, or have suggested entries for future editions of the SUMMER OF CLARITY.
Translation ©2025 RJ Andrews. All rights reserved.
About
RJ Andrews helps organizations solve high-stakes problems by using visual metaphors and information graphics: charts, diagrams, and maps. His passion is studying the history of information graphics to discover design insights. See more at infoWeTrust.com.
RJ’s book, Info We Trust, is currently out now! He also published Information Graphic Visionaries, a book series celebrating three spectacular data visualization creators in 2022 with new writing, complete visual catalogs, and discoveries never seen by the public.
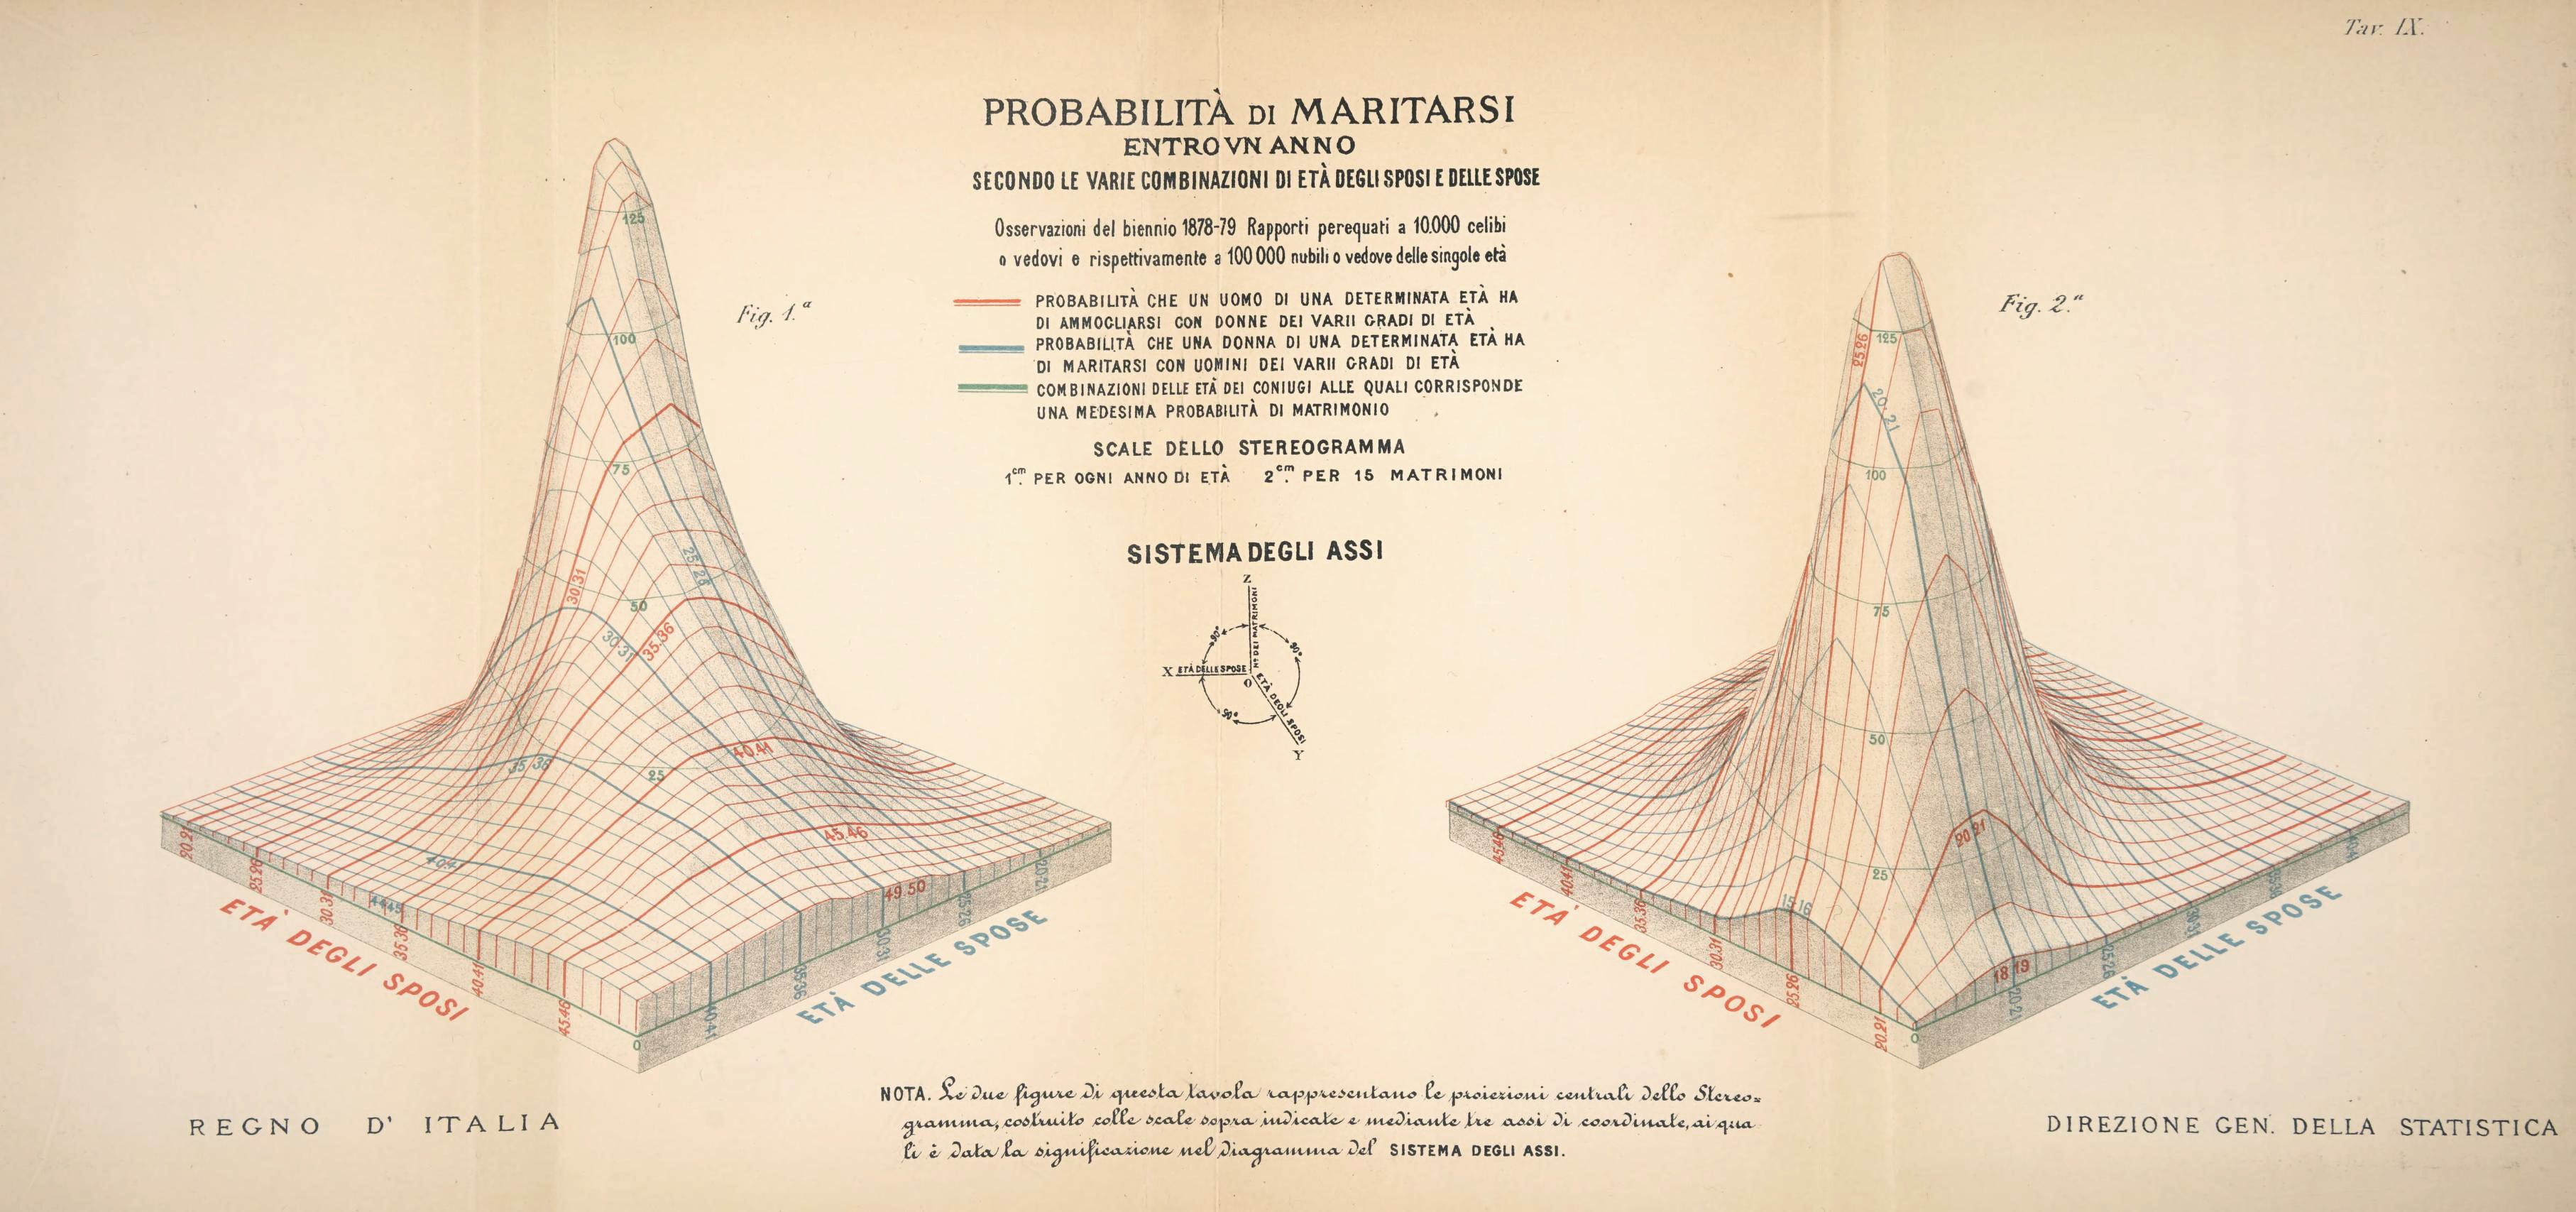
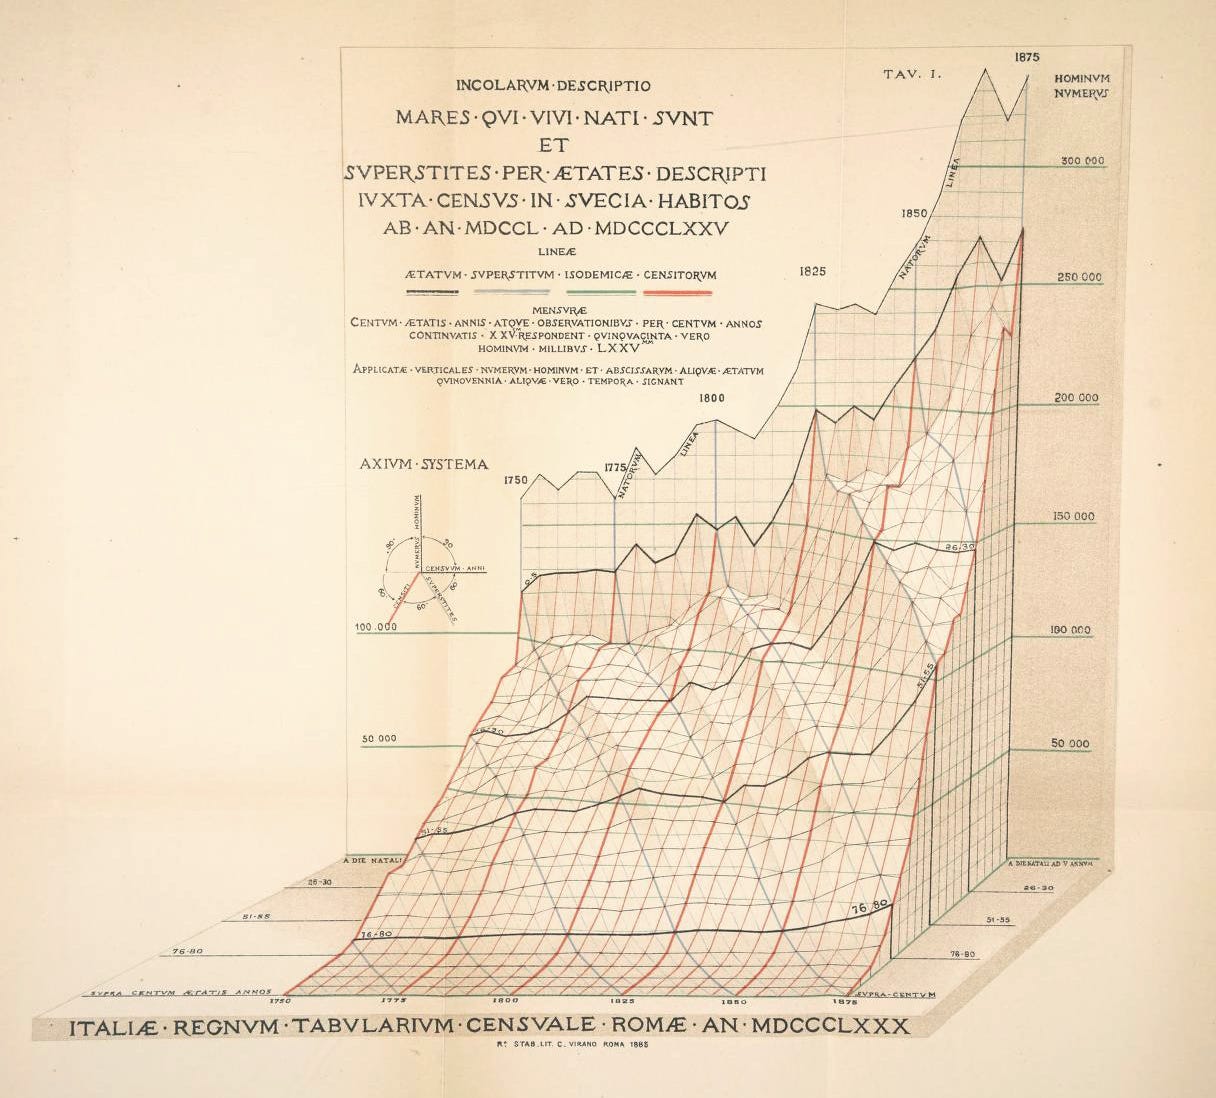
Really freaking cool historical perspective on information visualization. That 3D graph of marriage probabilities is so dope
Love it! 😍