Welcome to Chartography: insights and delights from the world of data storytelling.
This week, some light-hearted sundries, followed by my debut artwork: a hand typed map. Let’s go!
Sundries
🇺🇸 Cartoonist Nathan Pyle is anthropomorphizing every single U.S. state.
He really sells turning each state into a meaningful being by re-imagining the U.S.’s borders as the body of a little cutie. Look at the legs of Maine and Alabama.


I also admire how he sometimes turns a portion of the country into furniture.


Pyle is about halfway through the series. See the rest on Twitter.
🌐 What if you could read a Wikipedia article from the future? That’s the gimmick of the following short story.
MMAcevedo (Mnemonic Map/Acevedo), also known as Miguel, is the earliest executable image of a human brain. It is a snapshot of the living brain of neurology graduate Miguel Acevedo Álvarez (2010–2073), taken by researchers at the Uplift Laboratory at the University of New Mexico on August 1, 2031. Though it was not the first successful snapshot taken of the living state of a human brain, it was the first to be captured with sufficient fidelity that it could be run in simulation on computer hardware without succumbing to cascading errors and rapidly crashing.
Like many good sci-fi stories, this one gets a little dark as you keep reading:
Motivation
Iterative experimentation beginning in the mid-2030s has determined that the ideal way to secure MMAcevedo's cooperation in workload tasks is to provide it with a "current date" in the second quarter of 2033. MMAcevedo infers, correctly, that this is still during the earliest, most industrious years of emulated brain research. Providing MMAcevedo with a year of 2031 or 2032 causes it to become suspicious about the advanced fidelity of its operating environment. Providing it with a year in the 2040s or later prompts it to raise complex further questions about political and social change in the real world over the past decade(s).
Read the entire entry by qntm here.
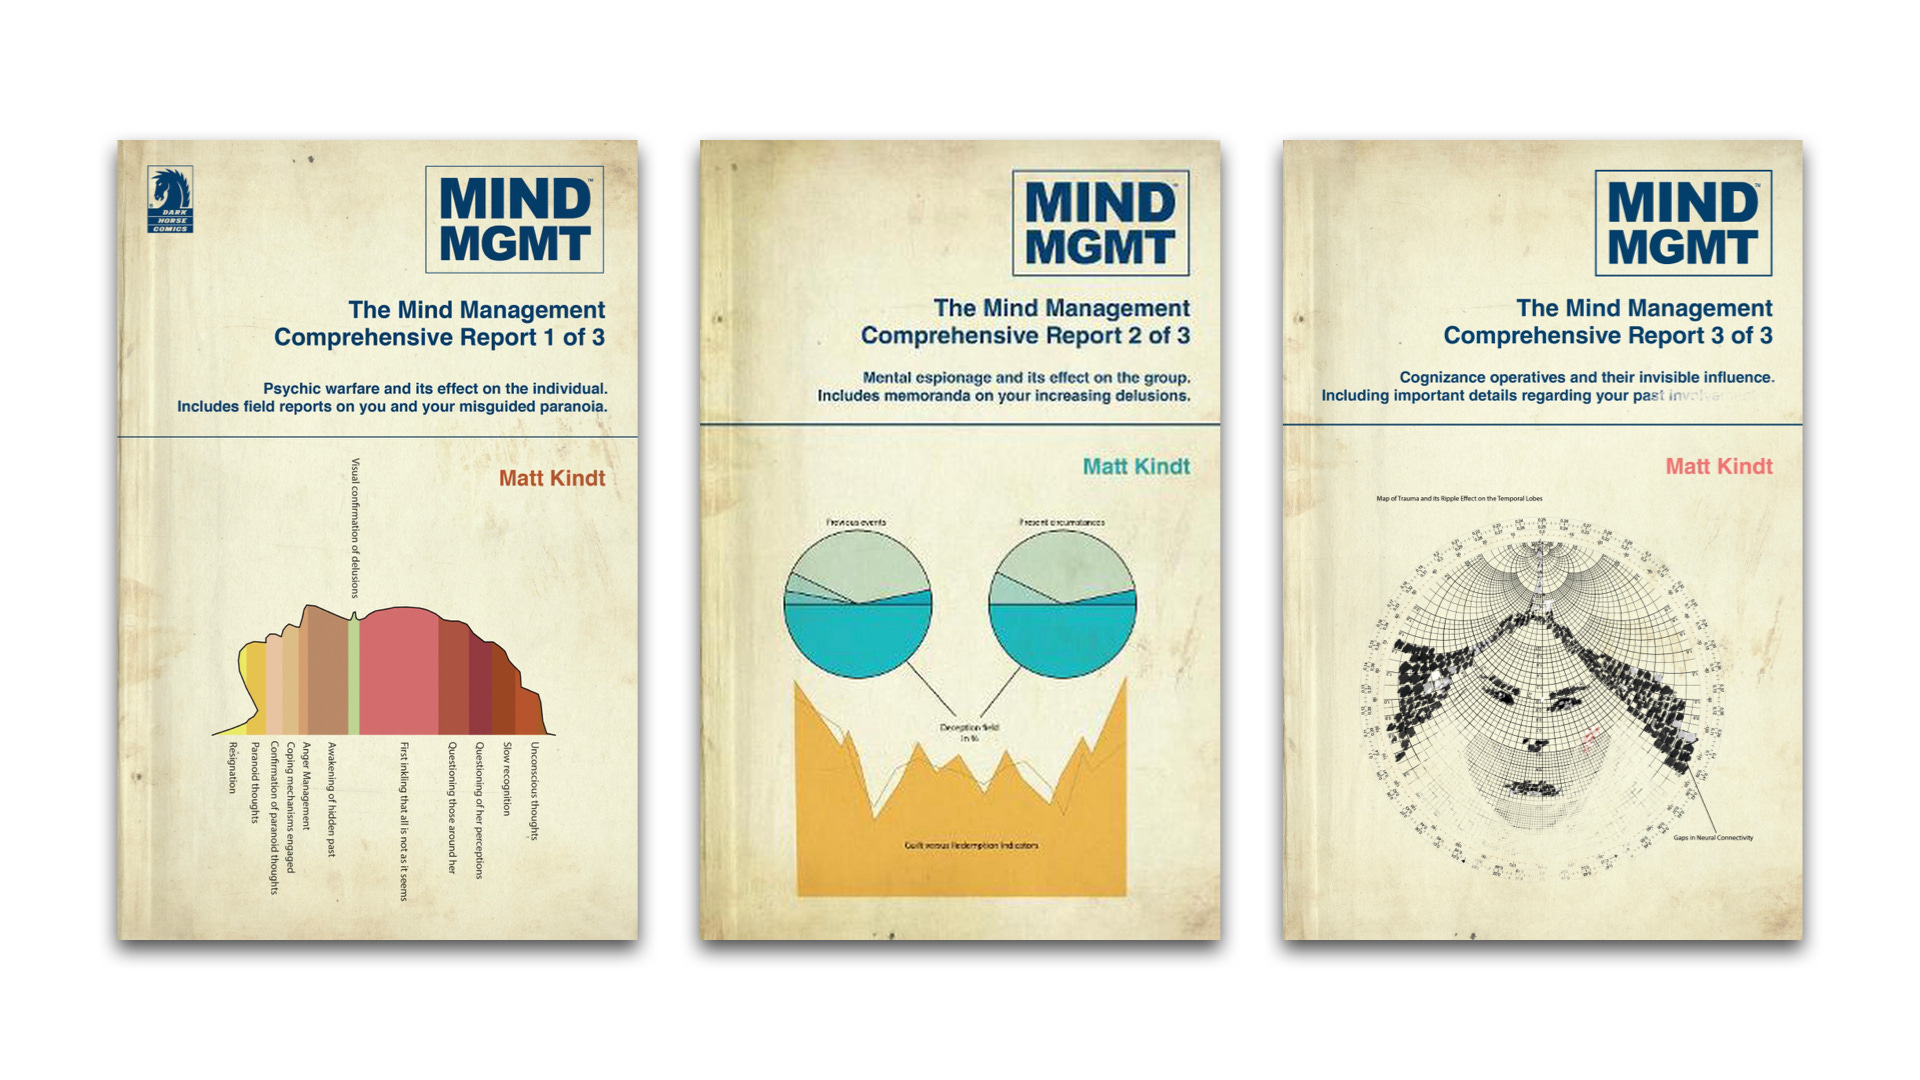
📚 MIND MGMT is a comic by Matt Kindt about a true crime writer who discovers a secret government agency. It hit my radar because their omnibus editions feature chart-faces!
Typewriter Cartography
In the last newsletter, Analog Dreams, I teased my antique typewriter as part of a quest to integrate the analog with the digital.
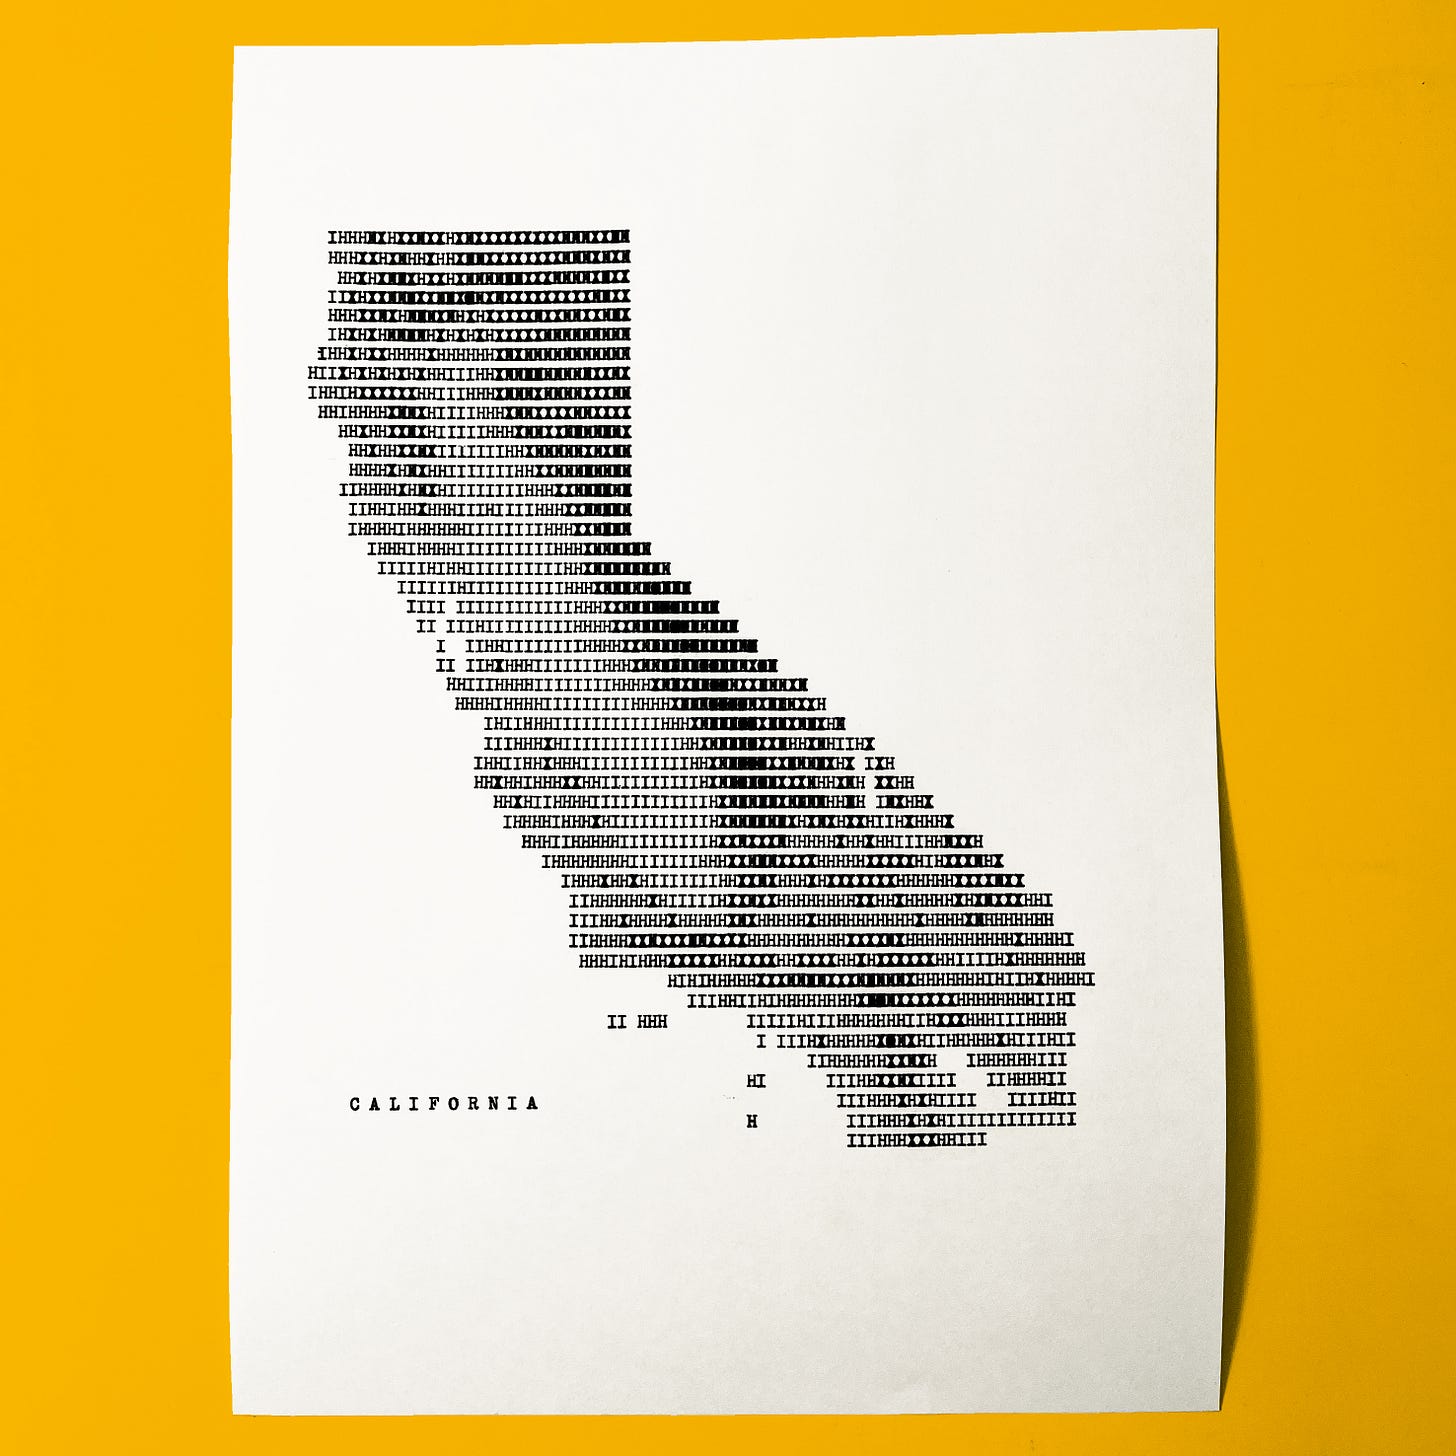
Today, I am absolutely over the moon to announce a milestone in my artistic journey—my debut original artwork, 'California', has been acquired by the famous David Rumsey Map Collection. David Rumsey’s patronage is not just a validation, it's a heartfelt encouragement of my artistic pursuits and marks the exciting kickoff of a new, thrilling chapter.
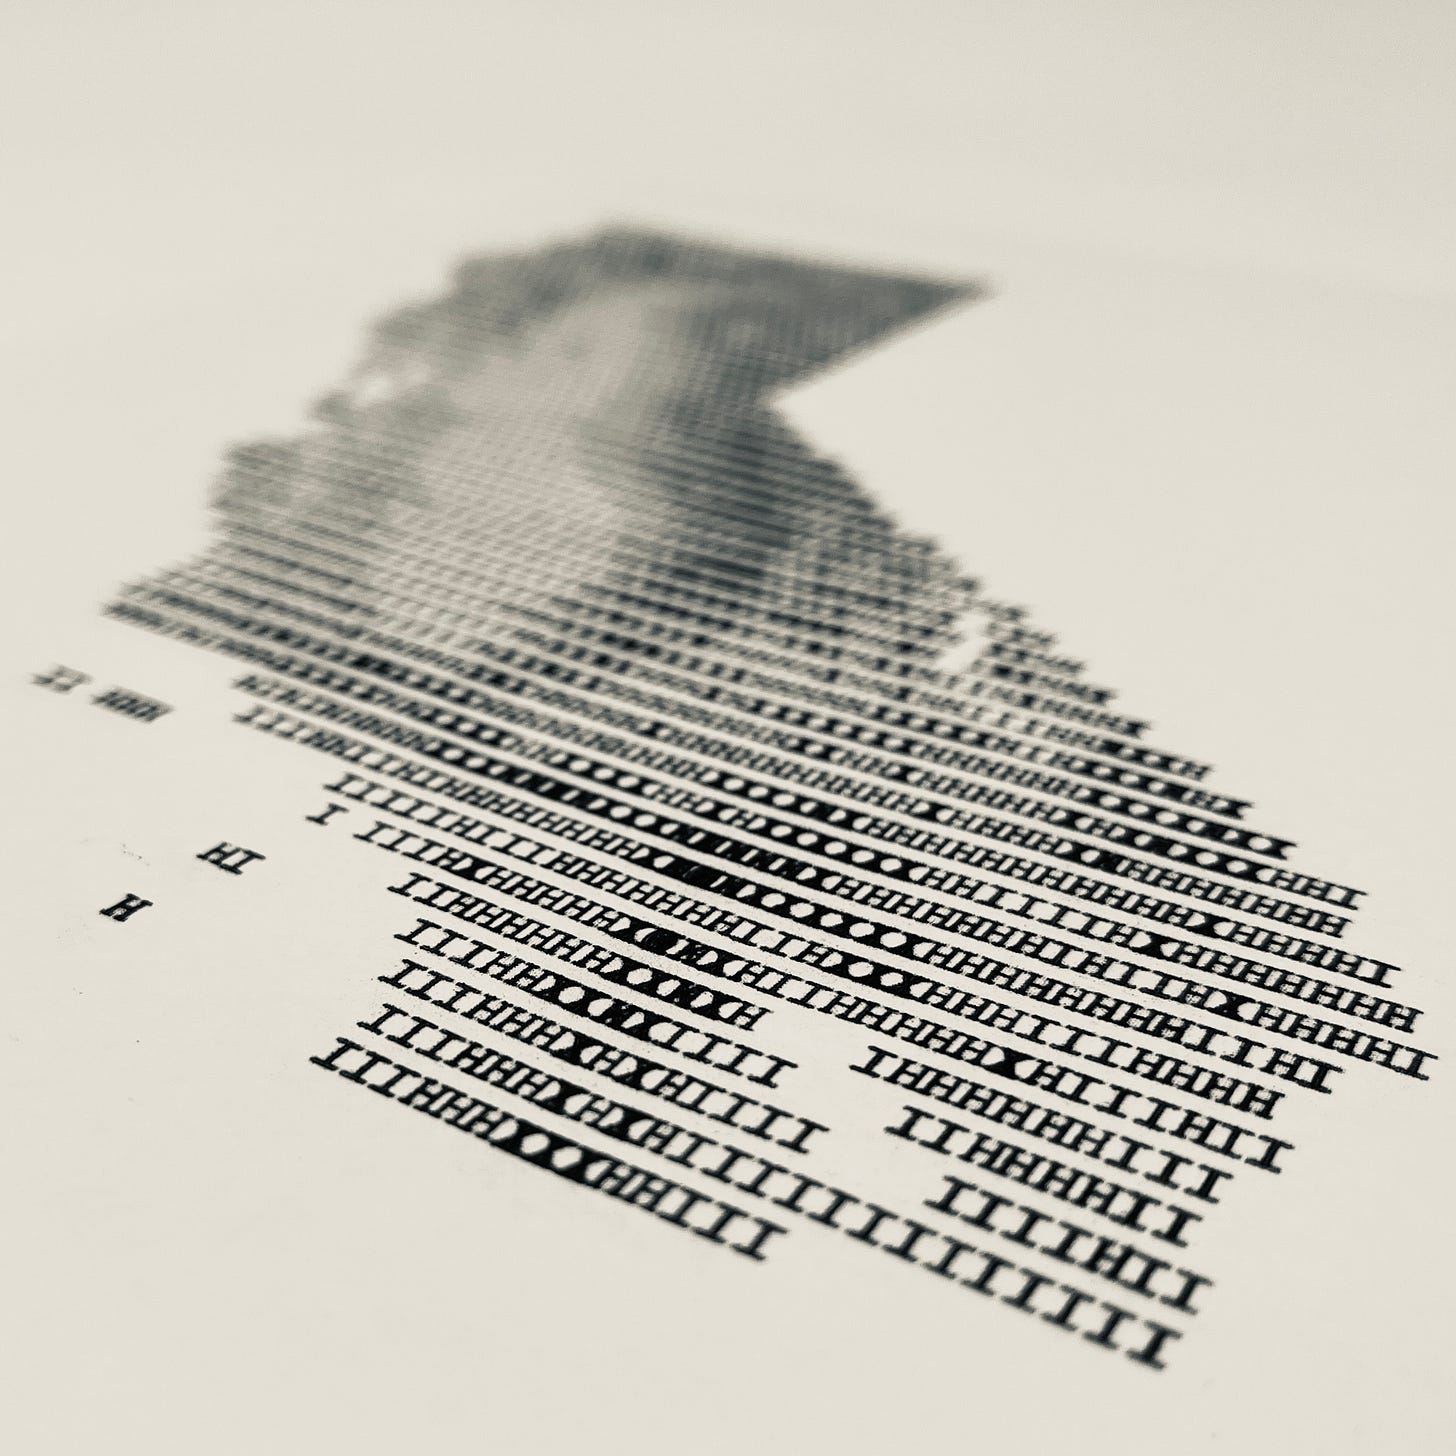
'California' isn't merely an art piece—it's a personal interpretation of the state's inherent beauty, crafted using my 1953 ROYAL Quiet De Luxe typewriter. This seven-class elevation map was designed to emphasize California's famous peaks, valleys, islands, coastline, and even areas below sea level. Custom quantization bins and intricate cell-by-cell decisions preserve the spectacular land flows unique to California, giving the piece its distinctive character.
Bringing California to life was an intricate performance. It required combinations of nearly 2,500 keystrokes, each struck by hand. Details, inspired by a California Albers projection at approximately a 1:5,000,000 scale, combine to elevate the spirit and diversity of the Golden State. The artwork is presented on Masa 77gsm paper from Japan, hand cut by me.
As a creator, my ambition is to delight, inform, and create pieces that leave an indelible impression. In the words of John Tukey, to “force us to notice what we never expected to see.”
You can see the piece in super high-resolution at the David Rumsey Map Collection. As I take my first steps into this new territory, I invite you to join me on this path of artistic exploration. Please feel free to share this exciting news with others who appreciate unique and thought-provoking art.
Together, let's spread the love for information design and its power to connect, inspire, and challenge conventional perspectives.
Onward!—RJ
Notes
Special thanks to Rob Simmon for help navigating some of the behind-the-scenes GIS magic that went into planning ‘California.’
I’m hardly the first to make maps with a typewriter. See 1905’s “Machine-Made Line Drawings For The Illustration Of Scientific Papers” (Archive), Harvard’s SYMAP program for line printer maps, and Daniel Huffman’s map of Michigan.
About
Data storyteller RJ Andrews helps organizations solve high-stakes problems by using visual metaphors and information graphics: charts, diagrams, and maps. His passion is studying the history of information graphics to discover design insights. See more at infoWeTrust.com.
RJ’s recently published series, Information Graphic Visionaries, a new book series celebrating three spectacular data visualization creators. With new writing, complete visual catalogs, and discoveries never seen by the public. His first book is Info We Trust, How to Inspire the World with Data., is currently being remastered for a new edition.


