
Getting lost in Zuantu
A new catalog of 71,294 historic Chinese visualizations.

Welcome to Chartography.net — insights and delights from the world of data storytelling.
The Info We Trust exhibition in NYC was a thrill.
Thank you to all who packed the gallery, and especially to every creator who supported the show with their beautiful work.
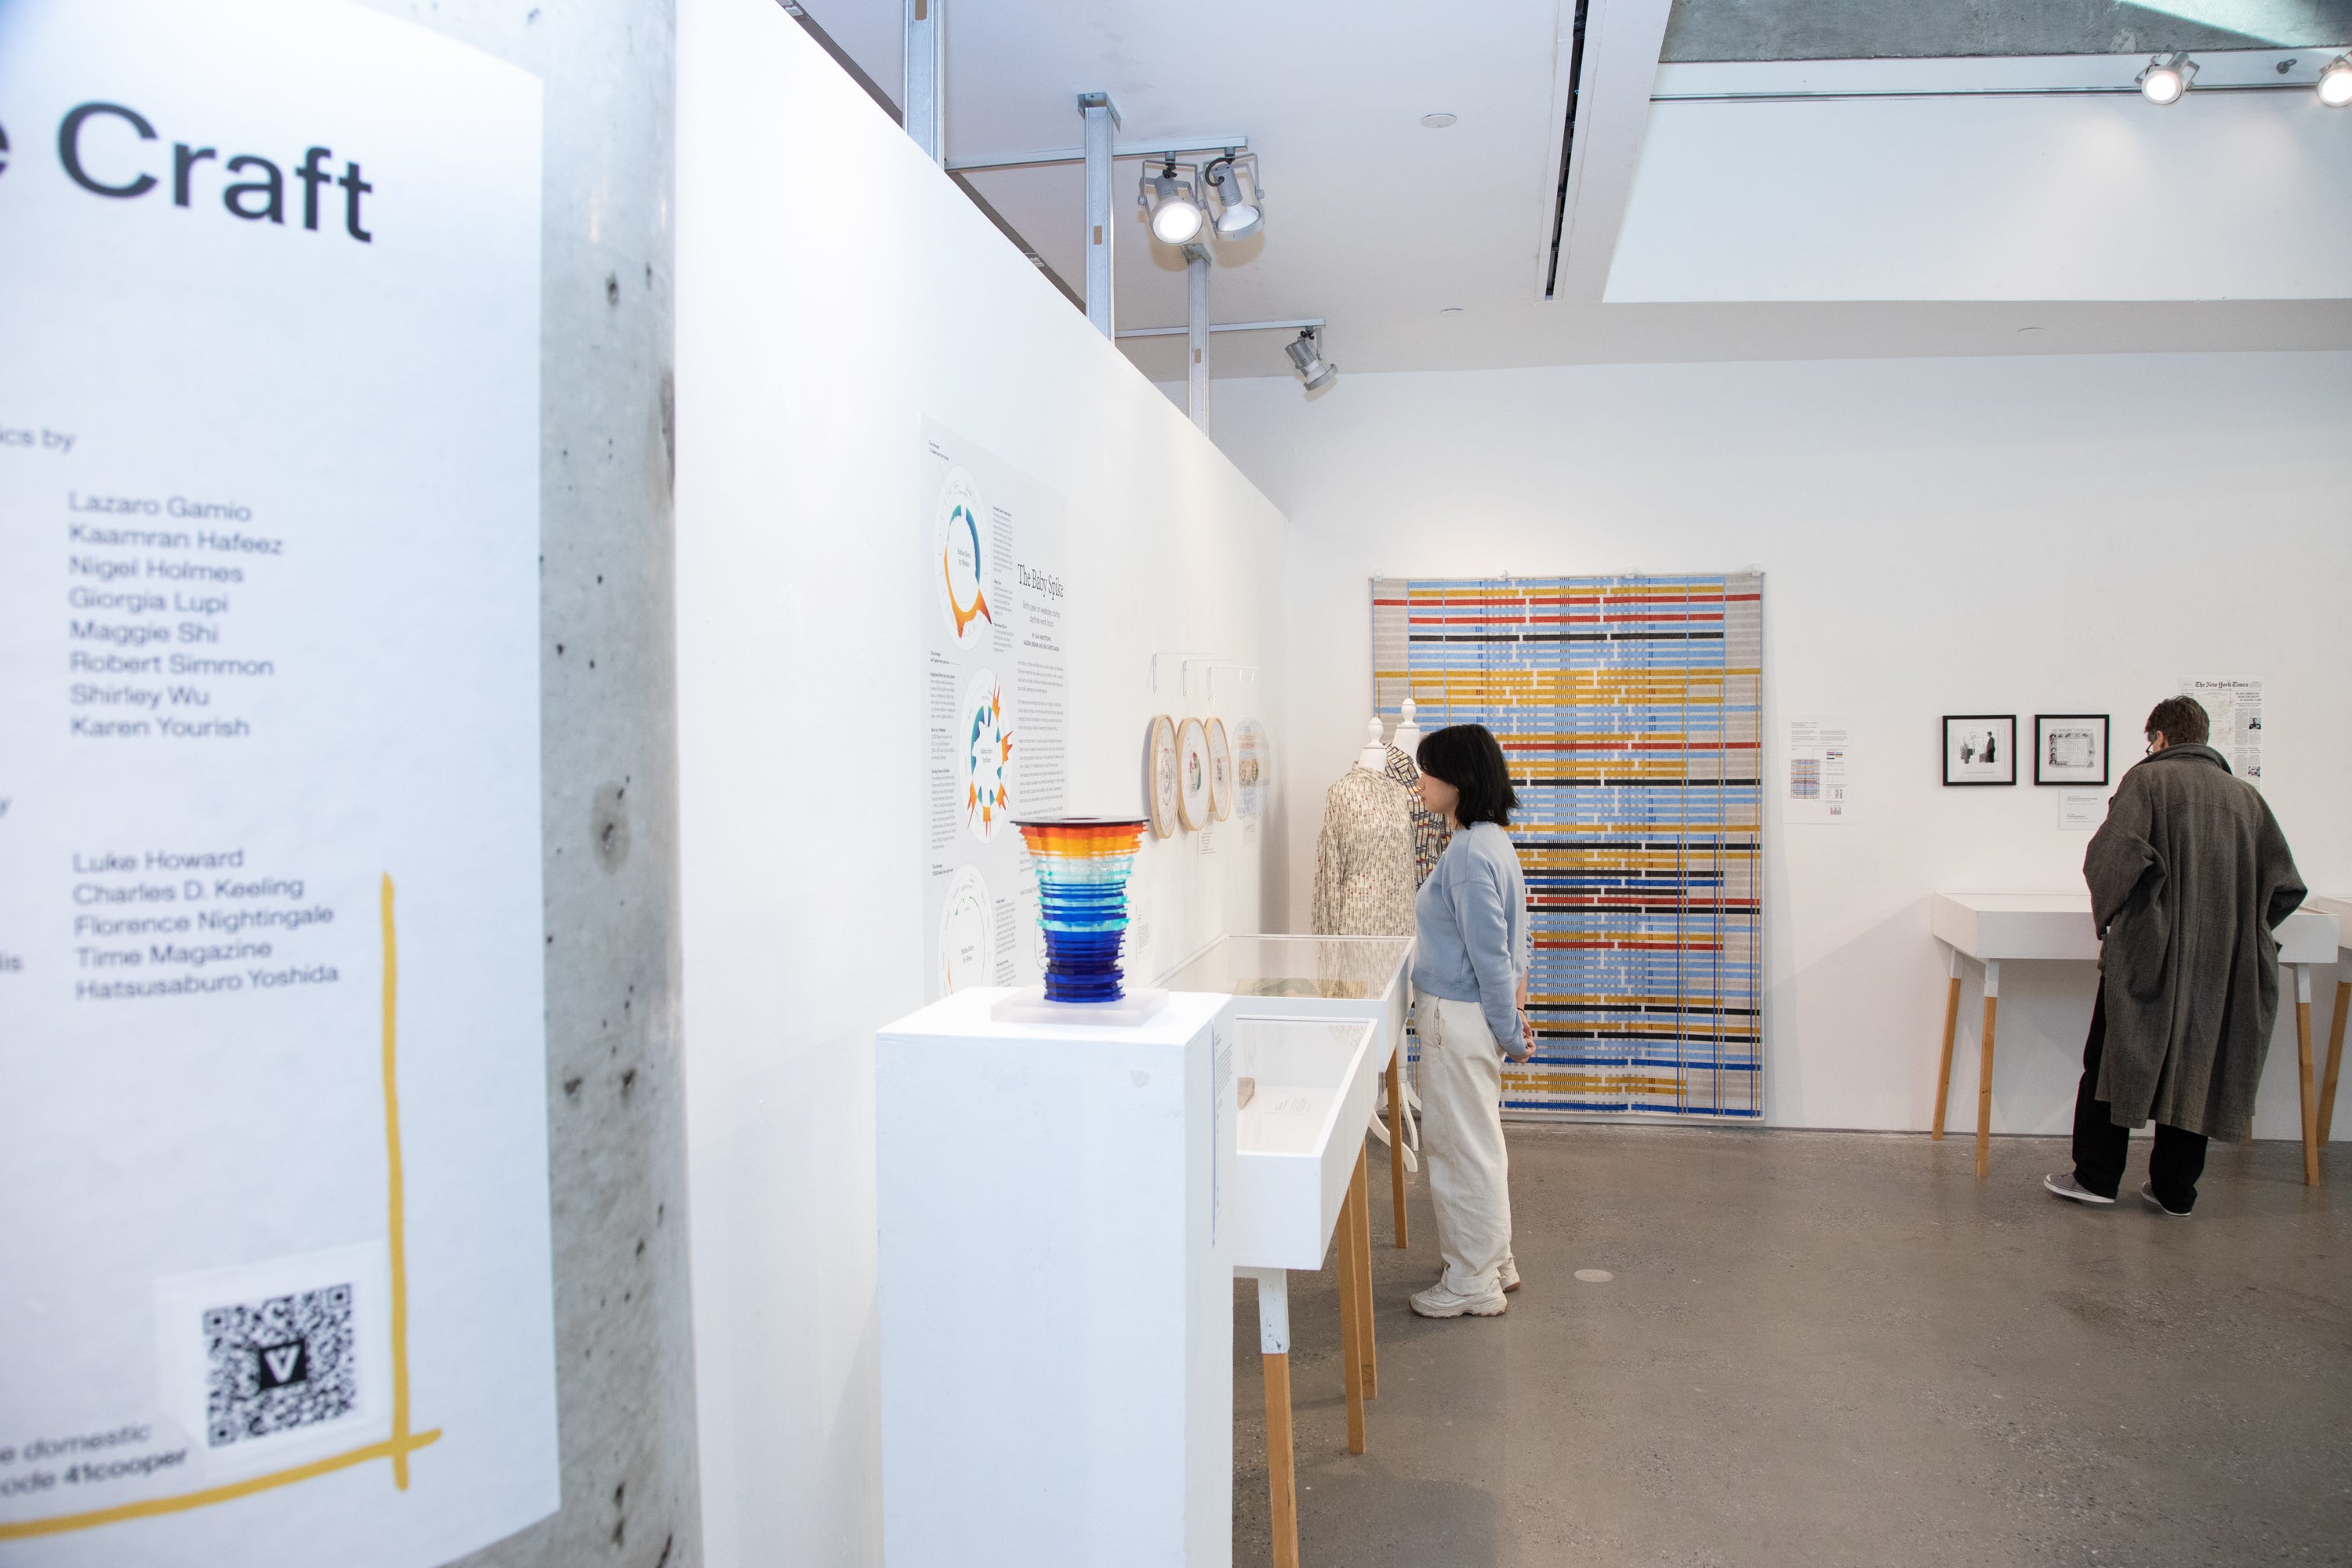
I’m still processing the experience, and waiting for more photos—both coming in a future edition of Chartography.
Getting lost in Zuantu
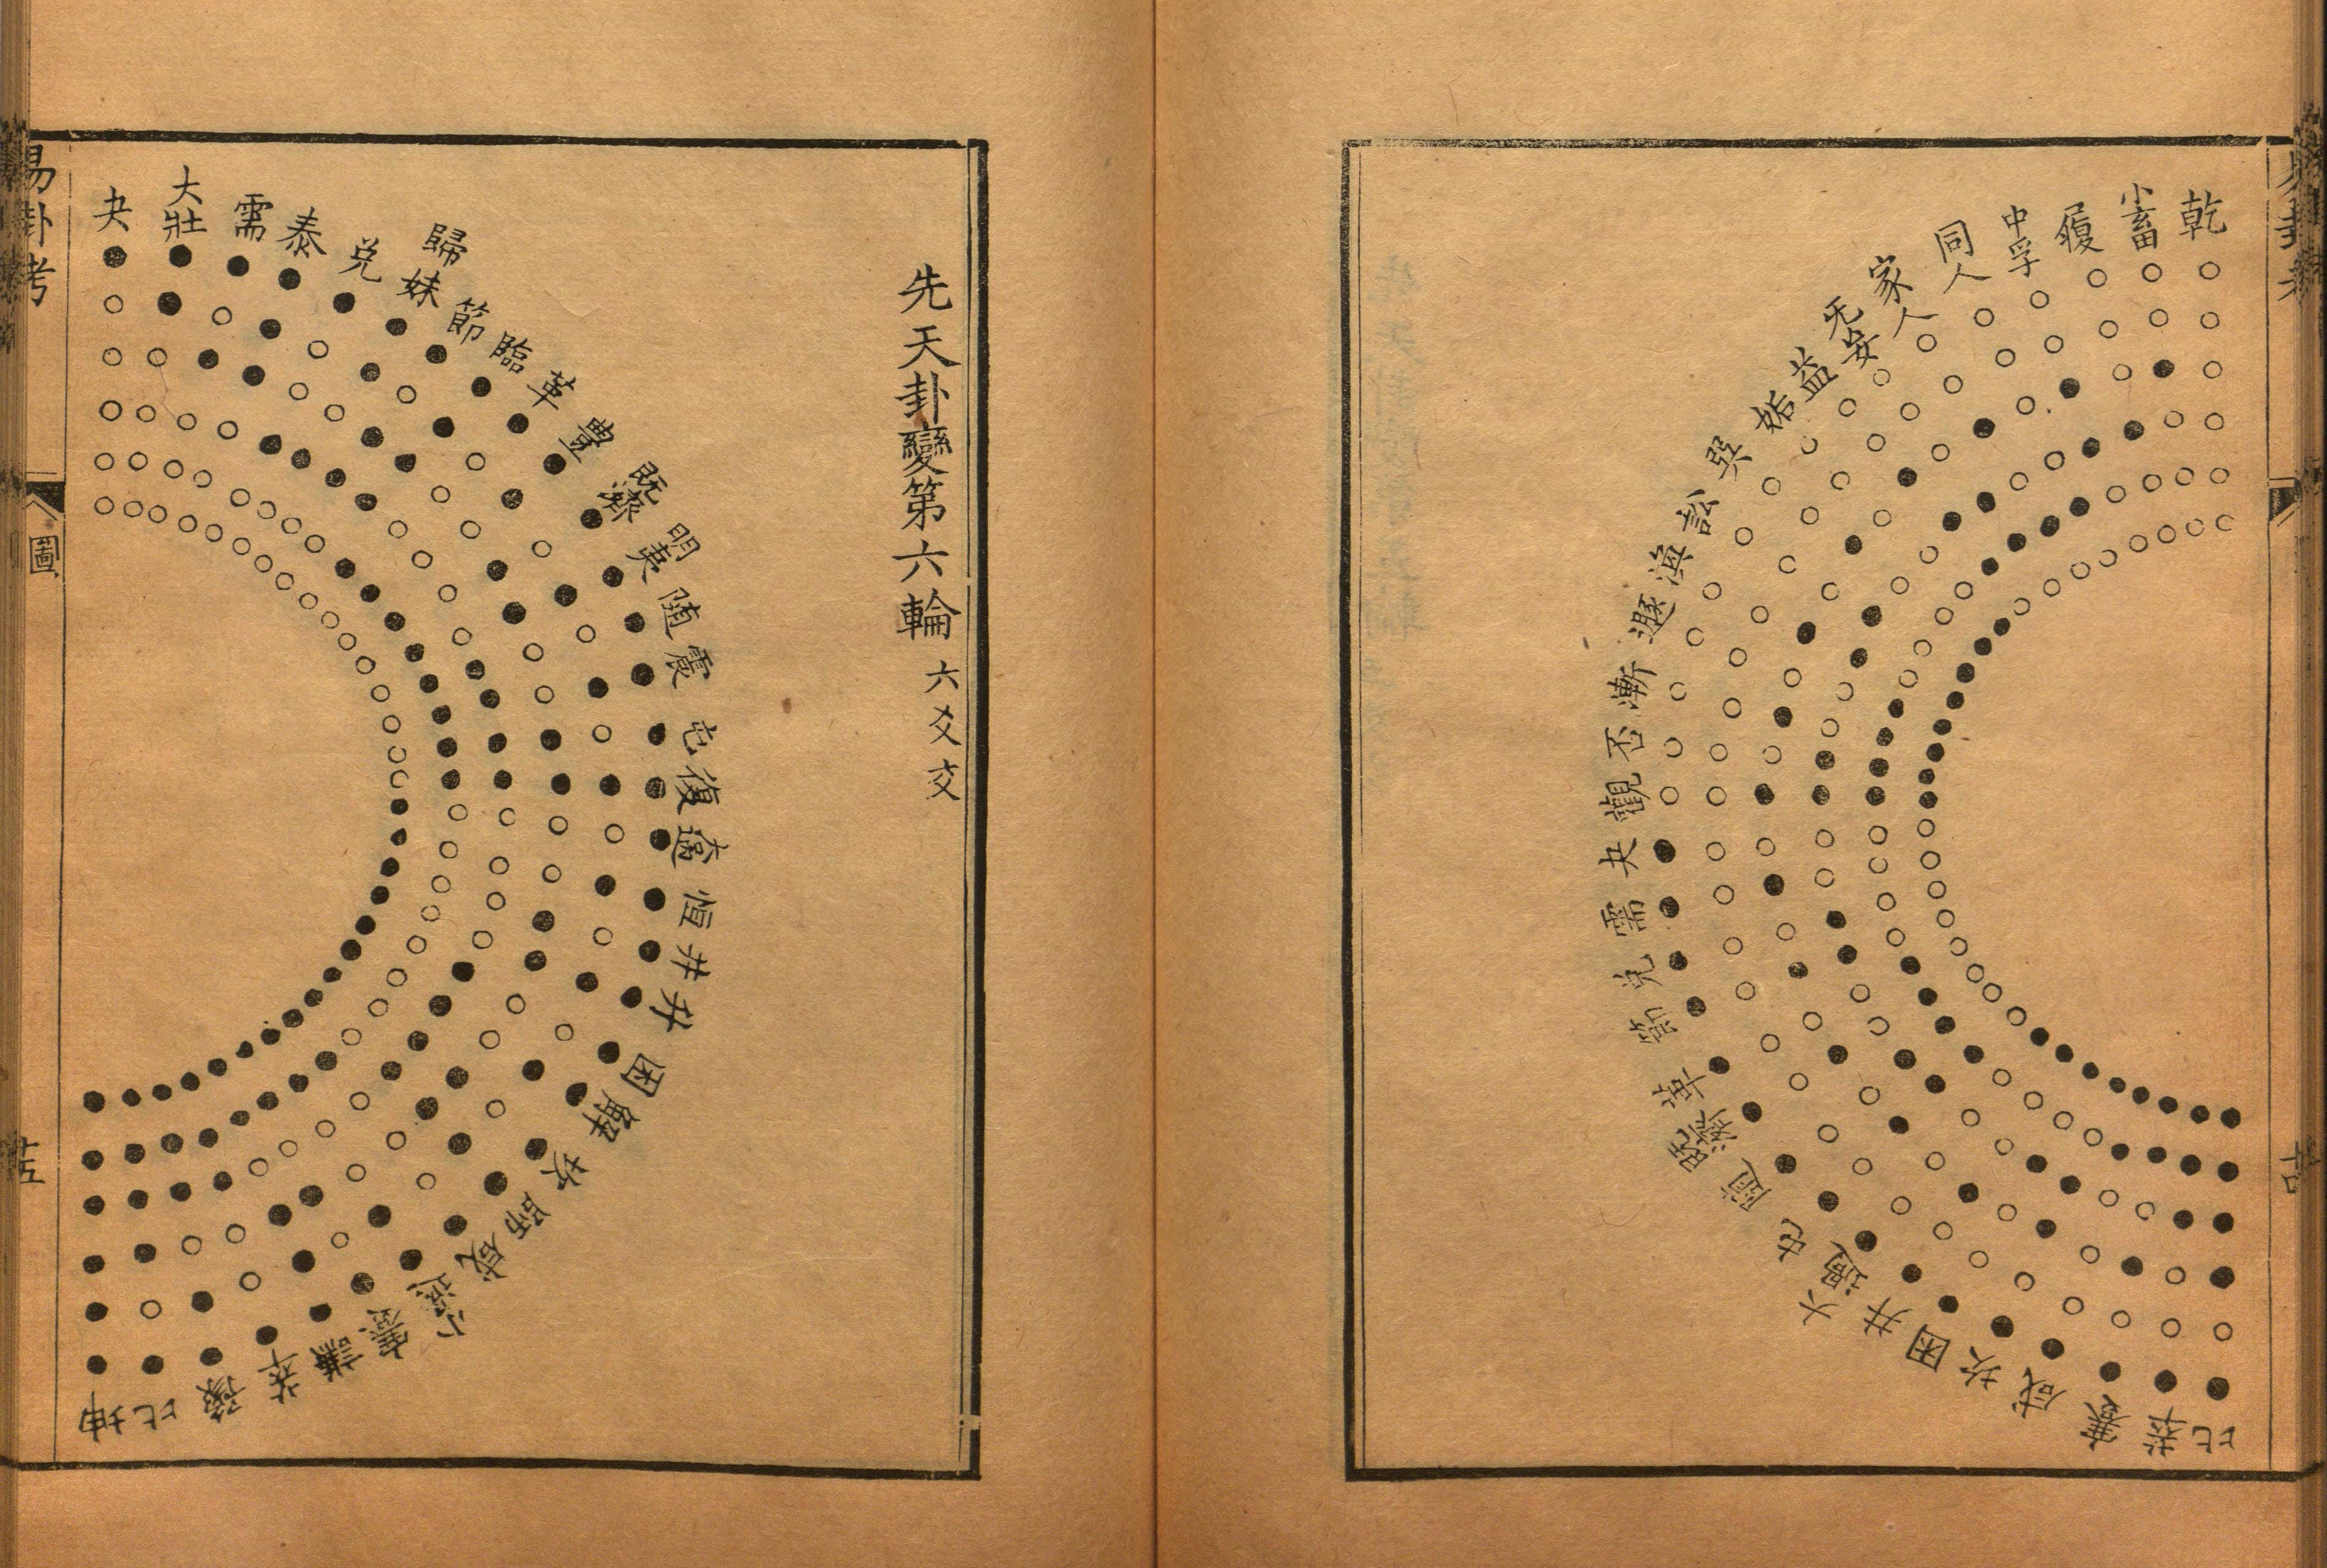
A team from Peking University and Oxford have launched a new tool to explore hundreds of thousands of Chinese visualizations and diagrams, like this 1620s calligraphic wonder:

From their publication for the ACM Conference on Human Factors in Computing Systems:
We propose ZuantuSet, a collection of historical Chinese visualizations. It is named after Zuan Tu (“纂圖” in Chinese), the classical Chinese term referring to the list of figures placed at the beginning of a book. Historical Chinese books contain diverse visual representations, some conveying data and concepts, while others do not encode data. In this work, we collect all visual representations and termed them as “graphics” with those conveying data classified as visualizations and decorative elements referred to as illustrations.
Their project overflows with centuries of visual abundance.
Most of the images are classified into types and themes and tagged with dates, supporting a nifty interface for exploration:

Inside visualization we find tables, maps, node-link diagrams, and trees. The “other” and “unclassified” categories are profitable too! After hours of browsing, beyond one illustrated translation of Euclid’s geometry, nothing suggesting a modern bar chart or line graph appeared to me. Your luck may be better.
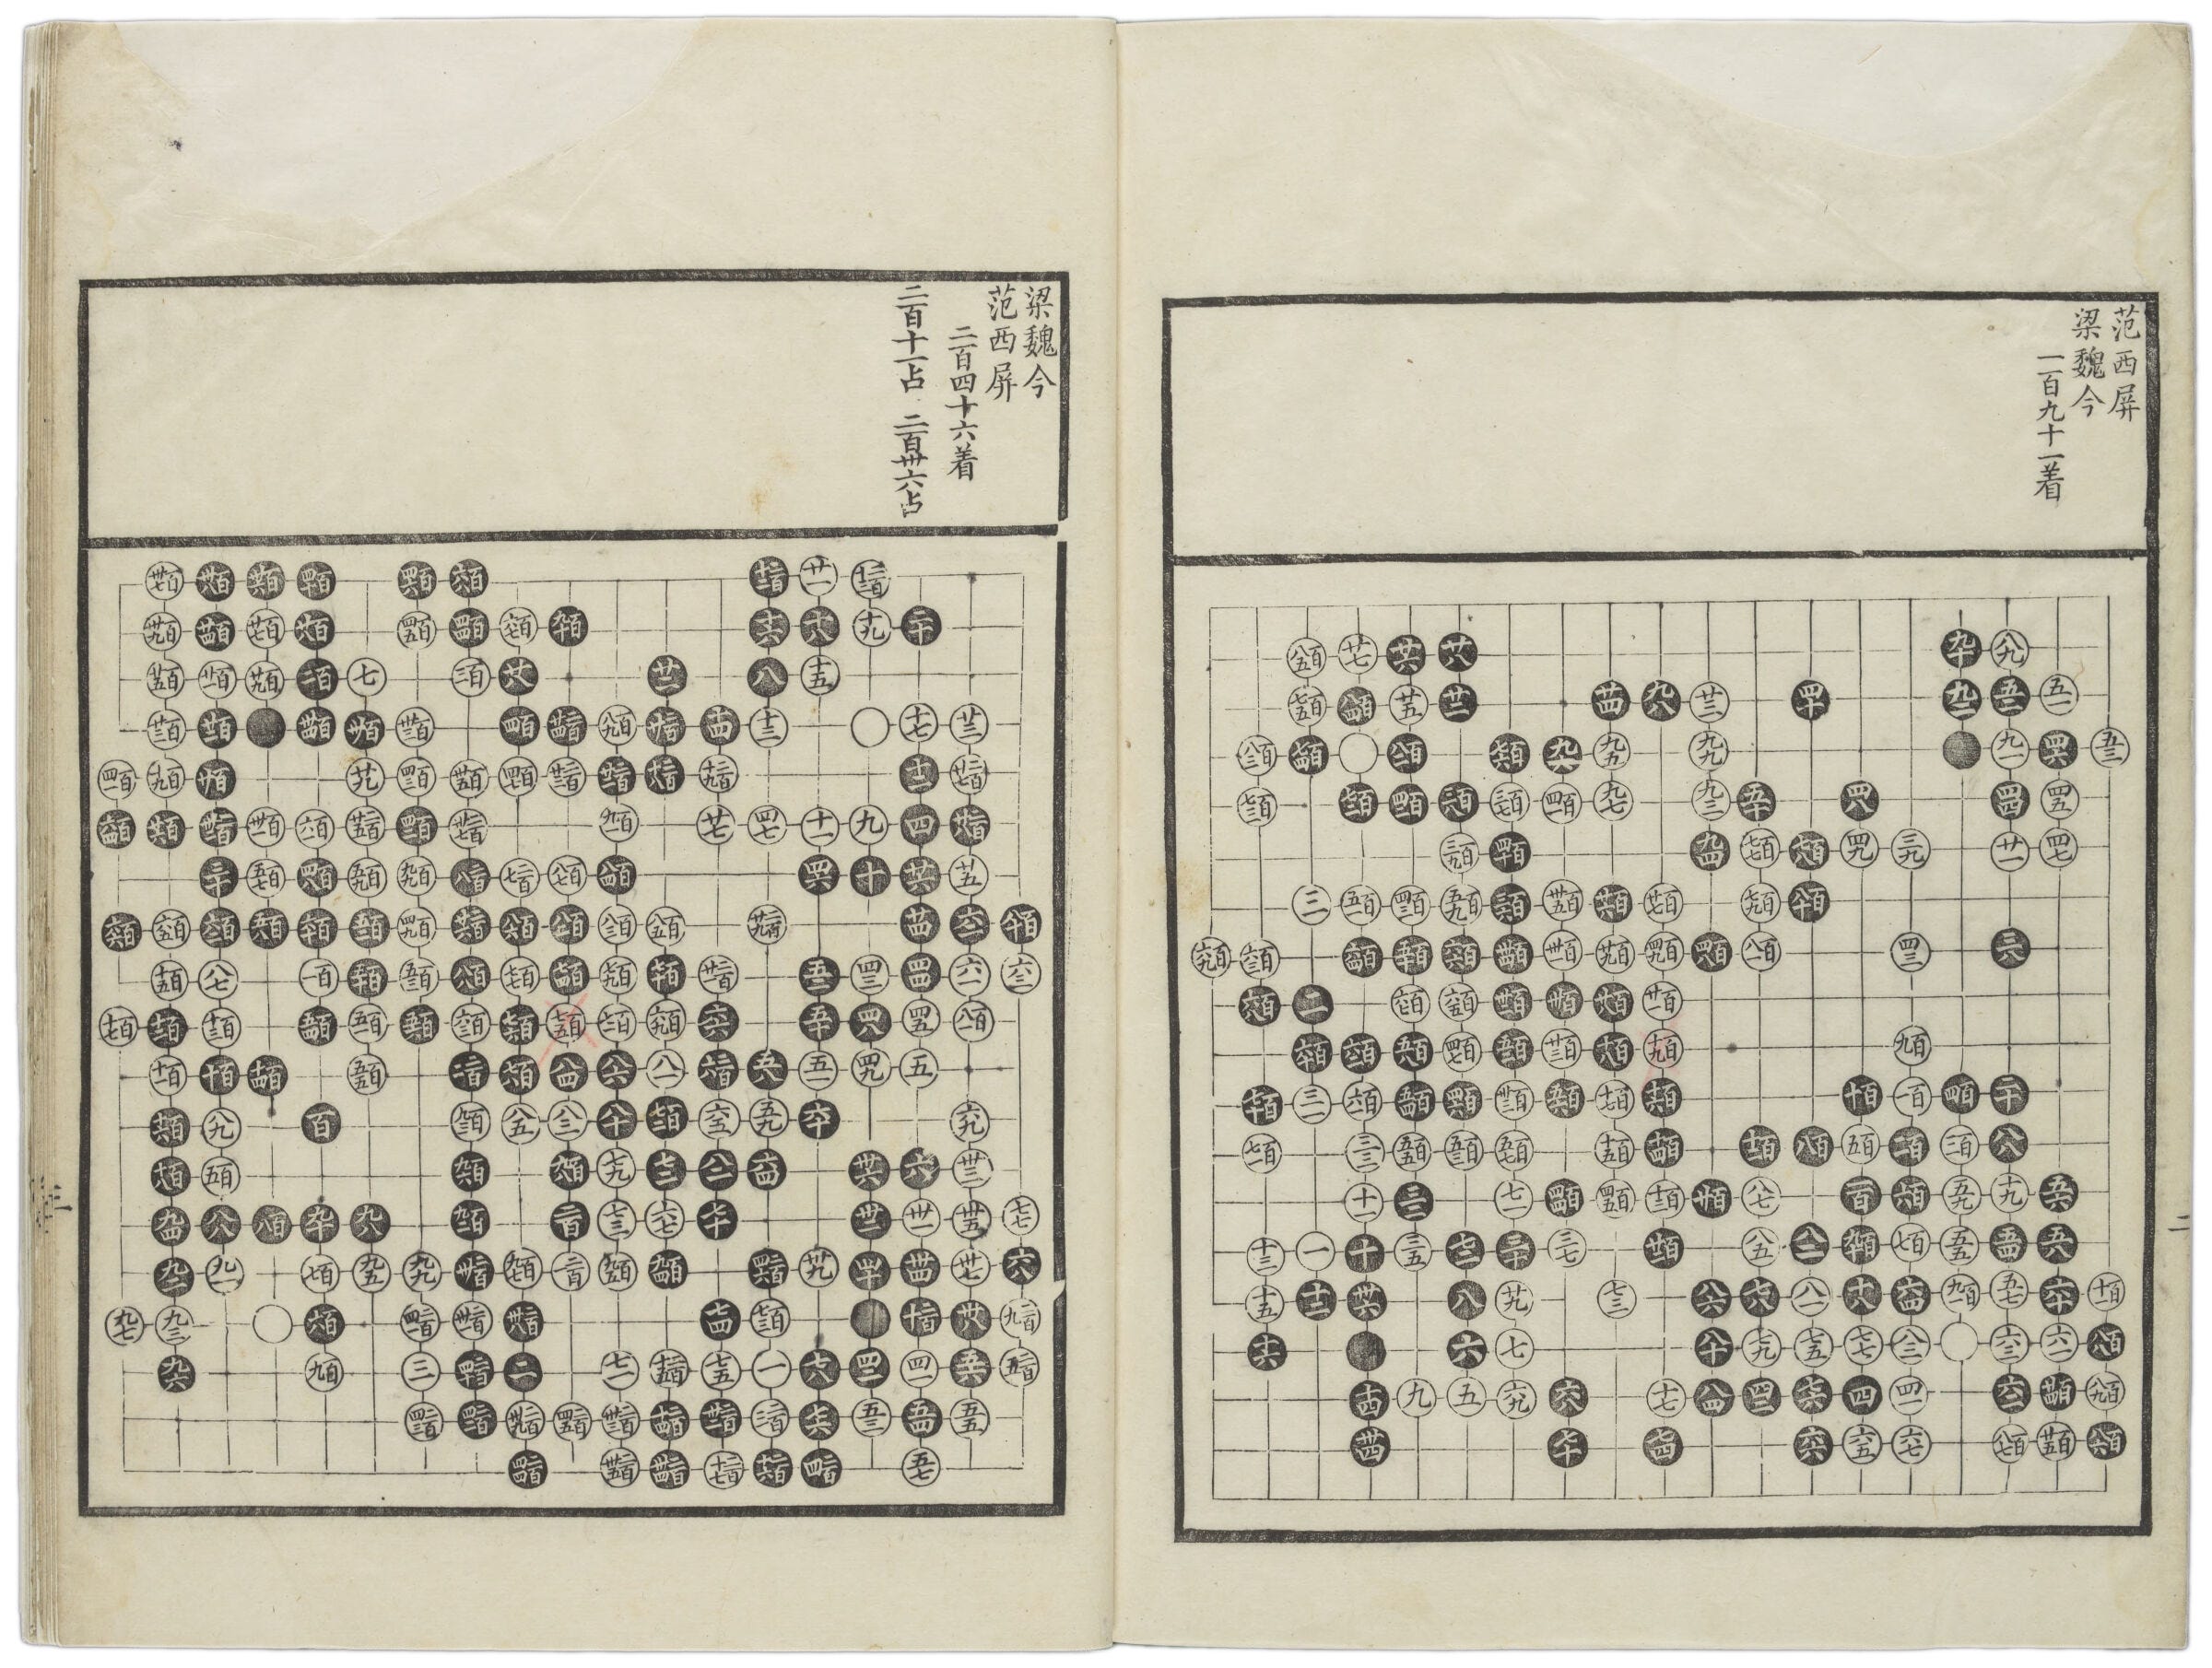
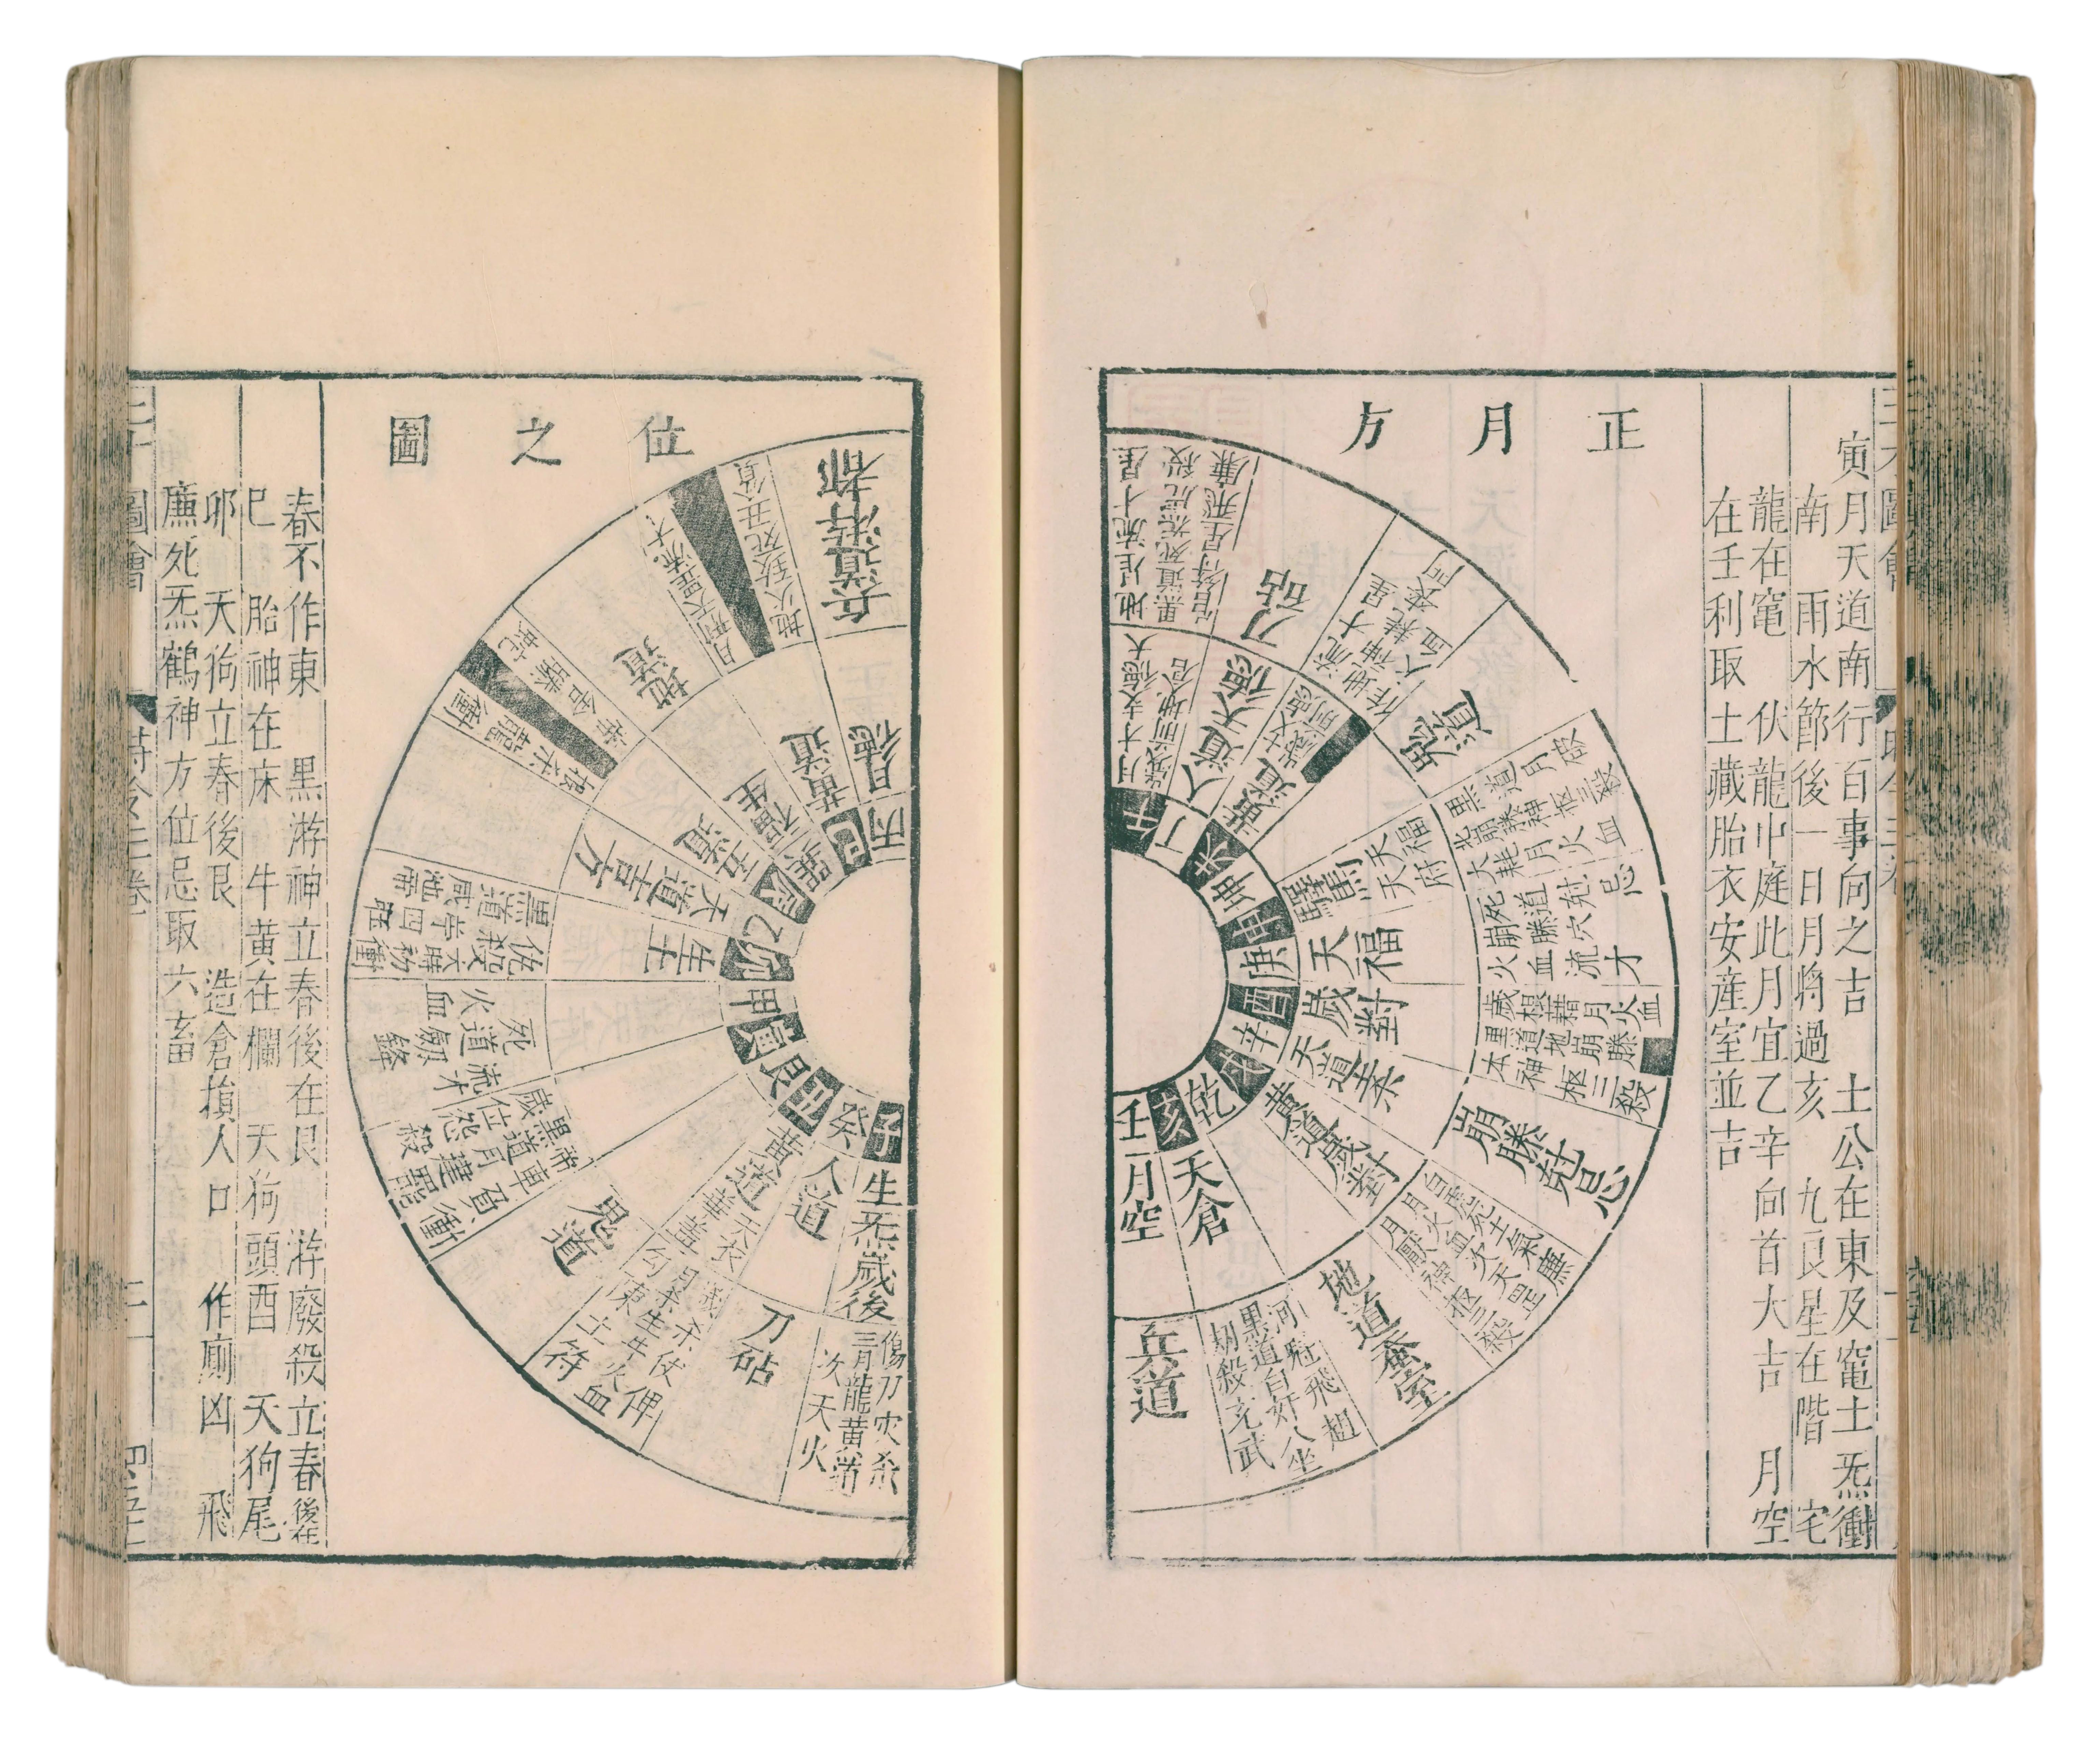
The abstract and geometric designs I found most intriguing follow. Many seem to be divination or mystical diagrams. Their meaning interests me less than their impact as pure visual forms.
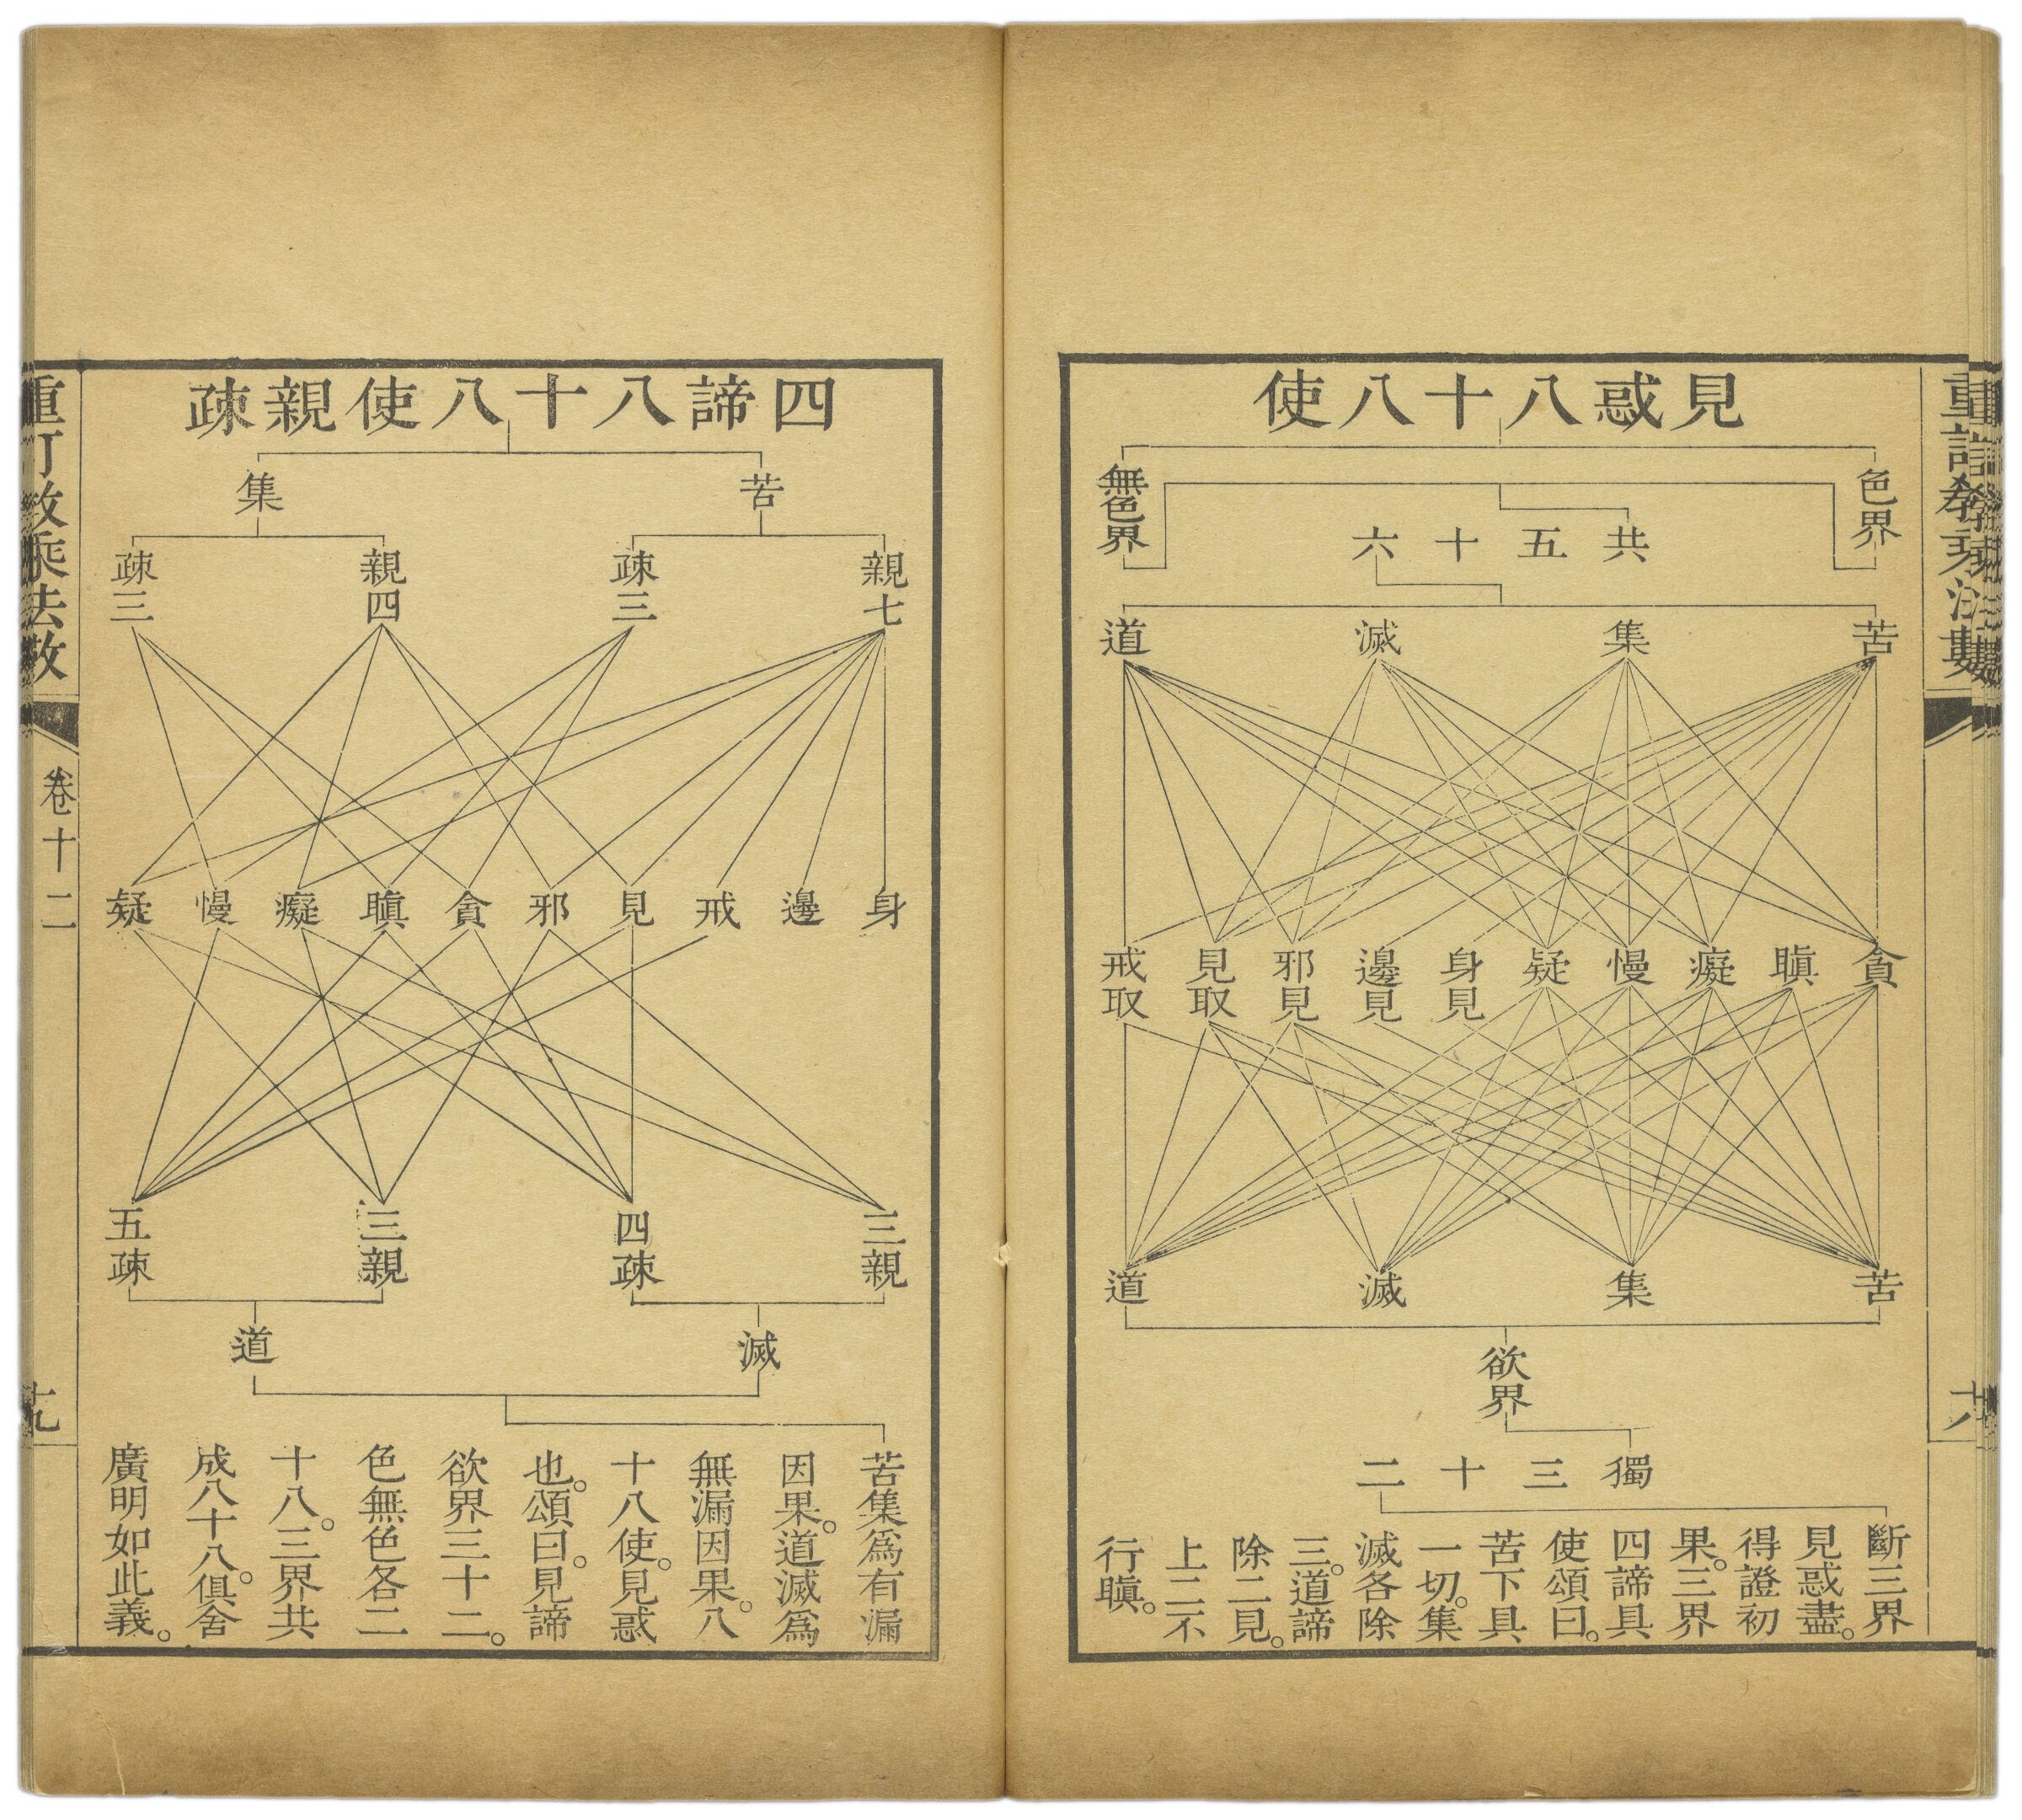
Each of these images represent a type that is repeated throughout its source publication. Each example is a member of a larger design system.
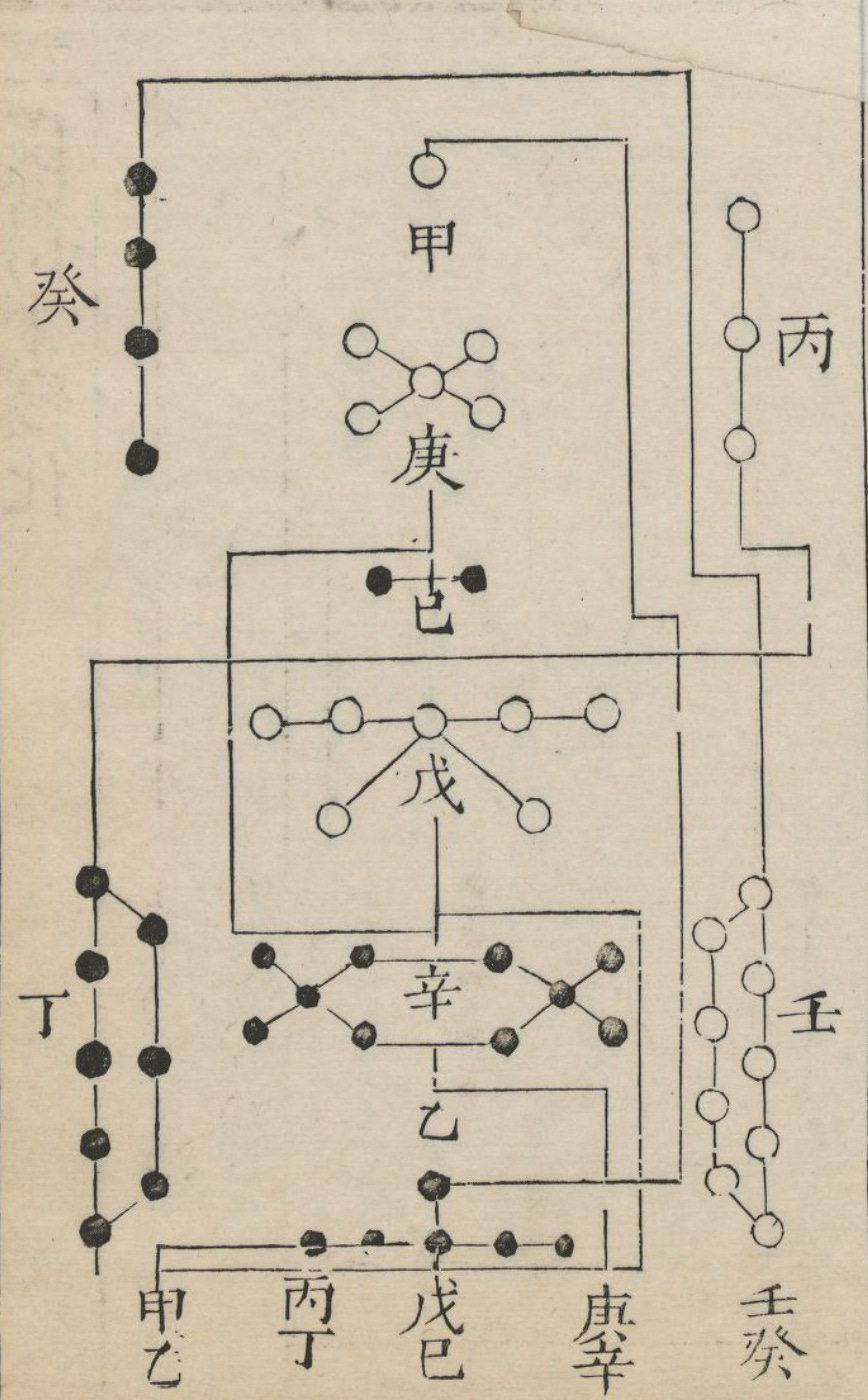
And each is executed in crisp black and white—yielding a clean design that in many instances still appears fresh 400 years later.
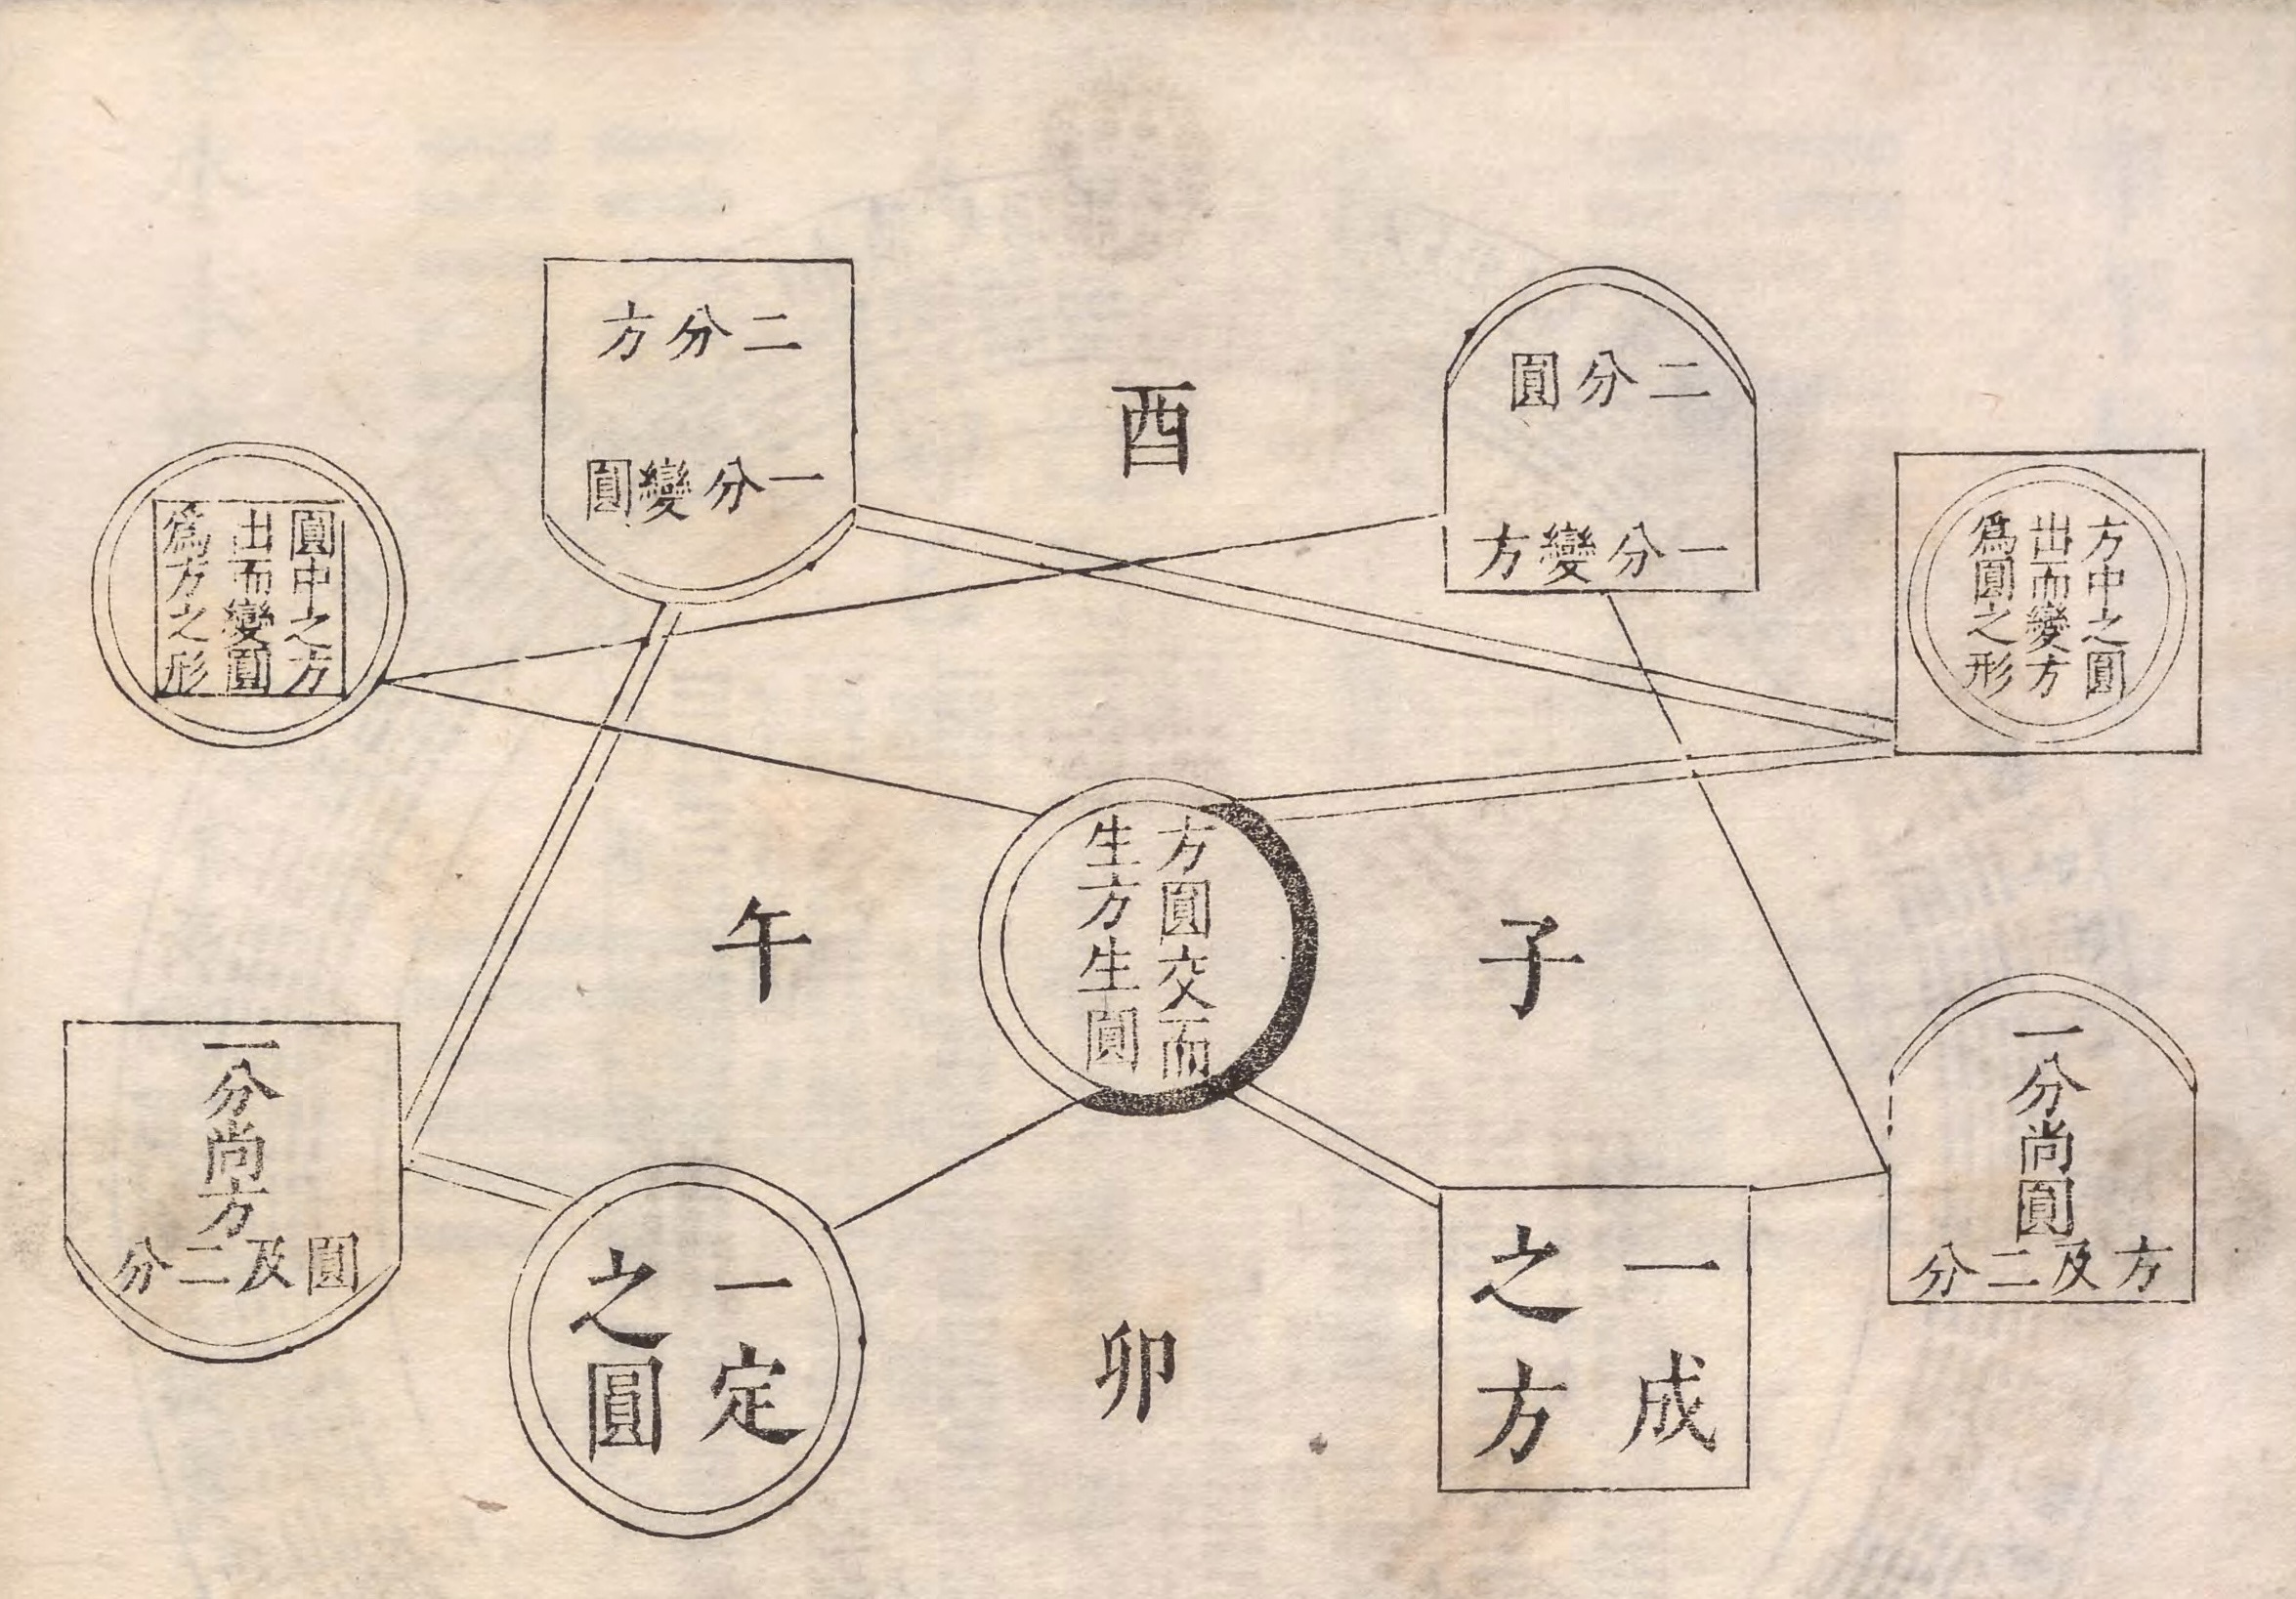
I envy Chinese calligraphic characters. They can serve as isolated marks. They can be written in any direction. Their tidy flexibility makes them suited to information design in ways that english words could never.
ZuantuSet also contains thousands of fascinating biological and geographical diagrams. Explore all here: https://zuantuset.github.io/gallery/#/ And read all about it too: https://arxiv.org/pdf/2502.19093

More of our craft’s history is being discovered, digitized, published, and made explorable. What else is out there?
Onward!
—RJ
About
RJ Andrews helps organizations solve high-stakes problems by using visual metaphors and information graphics: charts, diagrams, and maps. His passion is studying the history of information graphics to discover design insights. See more at infoWeTrust.com.
RJ’s book, Info We Trust, is currently out now! He published Information Graphic Visionaries, a book series celebrating three spectacular data visualization creators in 2022 with new writing, complete visual catalogs, and discoveries never seen by the public.
What a beauty!! 😍