
"My Maps Speak"
Minard's reflections on his useful idea, part 2.

Welcome to Chartography.net — insights and delights from the world of data storytelling.
This summer, we are showcasing a series of historic writing about information design. It is the SUMMER OF CLARITY! These essay inspired the blue marginalia in my new book Info We Trust ($39 from Visionary Press).
In 1861, Charles-Joseph Minard, eighty years old, published a treatise on his “useful idea”—ingenious flow maps which still inspire today. The essay reveals the design thinking behind his extraordinary intellectual and creative power.
The following original translation continues from part one, which you may reference for more background context. I’ve augmented Minard's original plates with images of works referenced by his text, but not illustrated in the original 1861 publication.
Graphic Tables and Figurative Maps (part 2)
[continued from part 1]
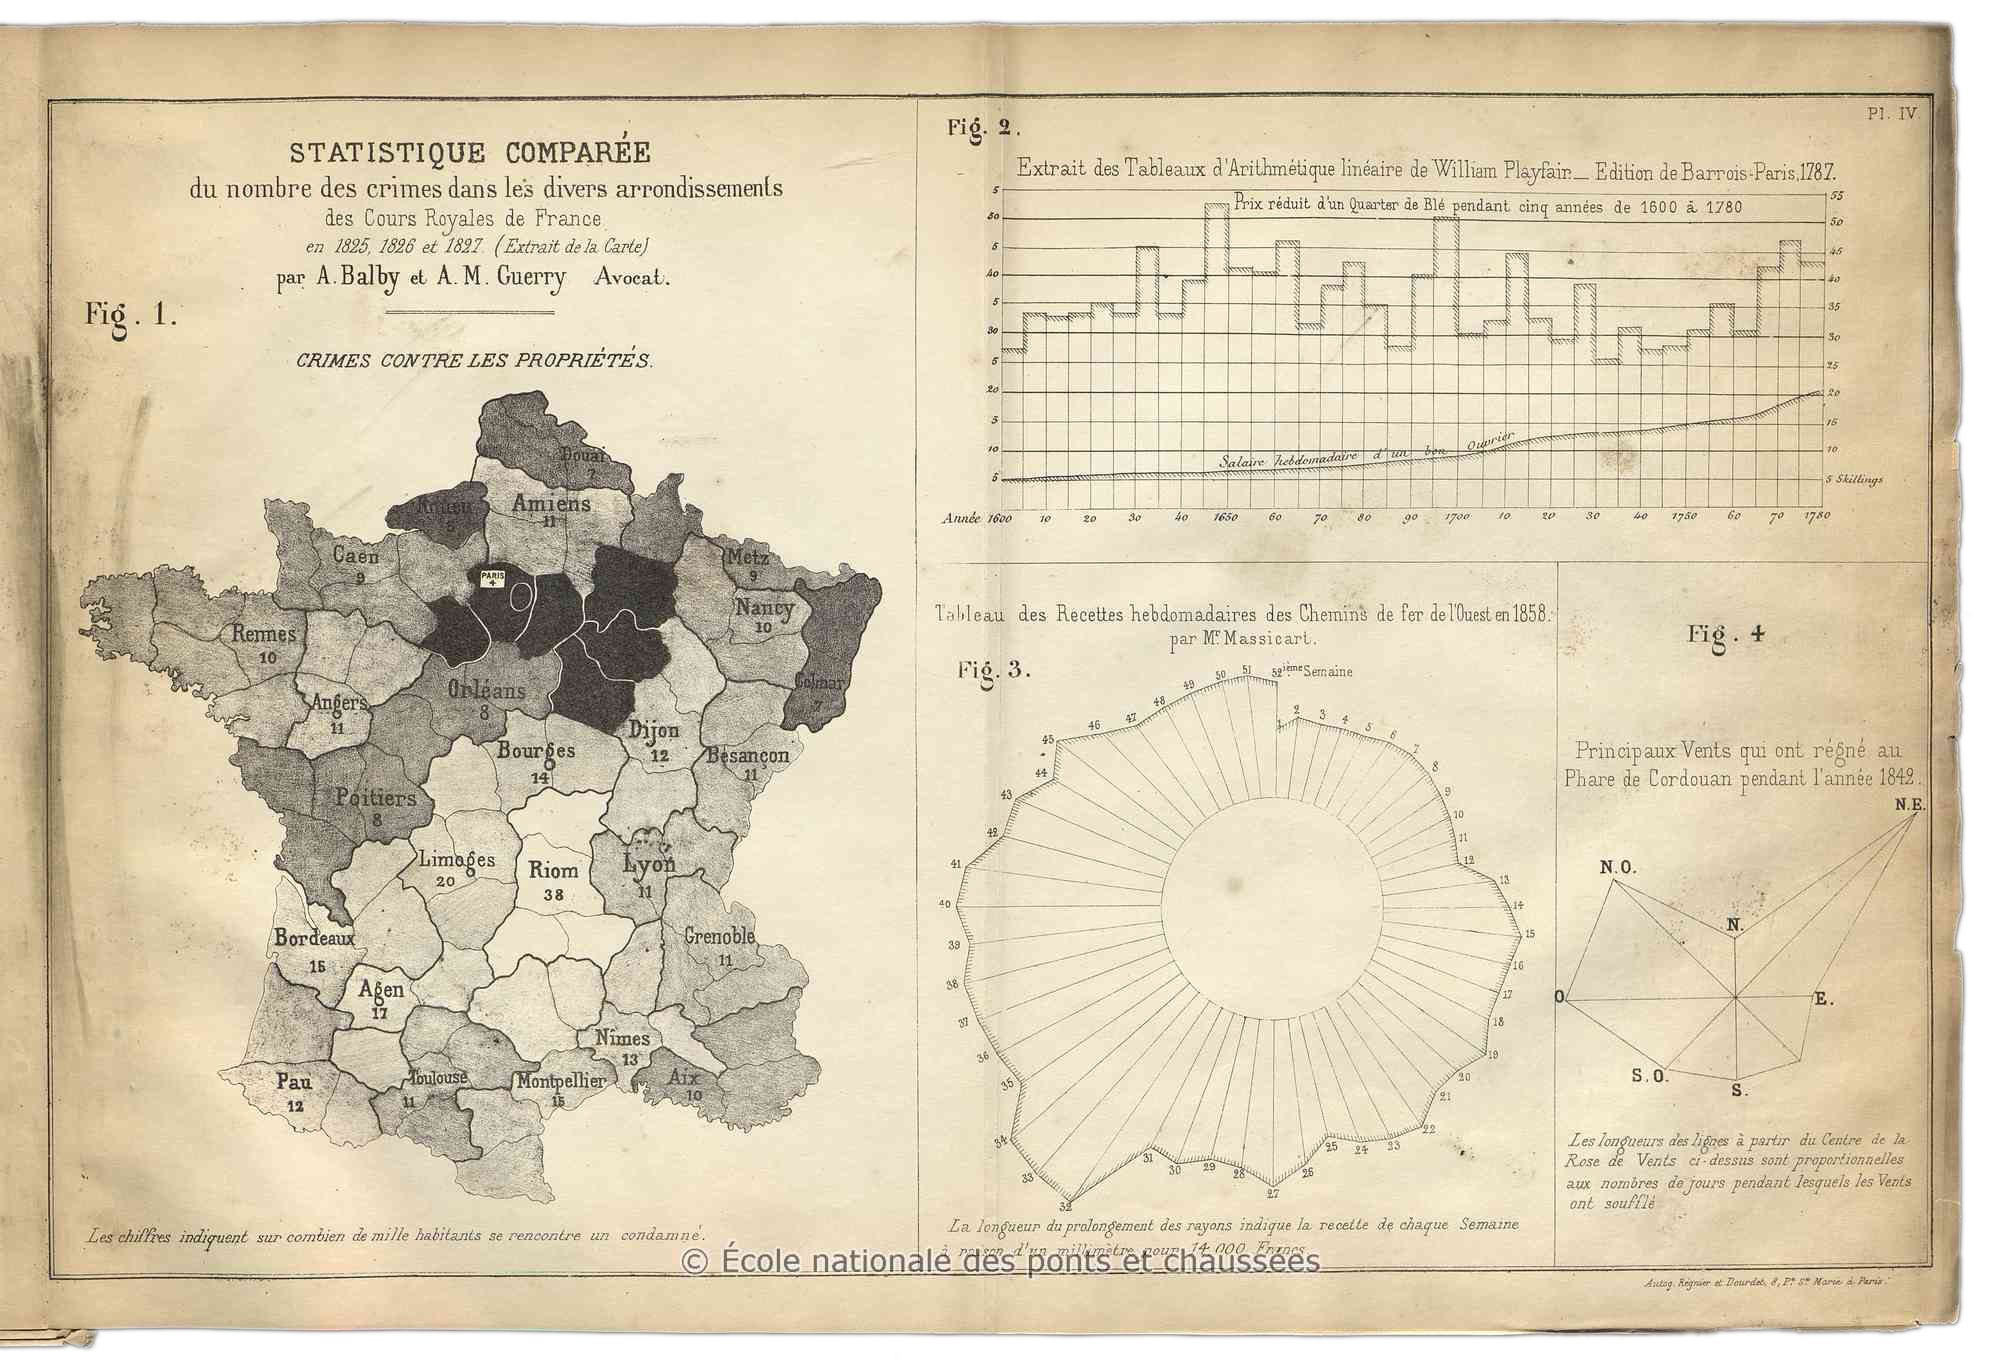
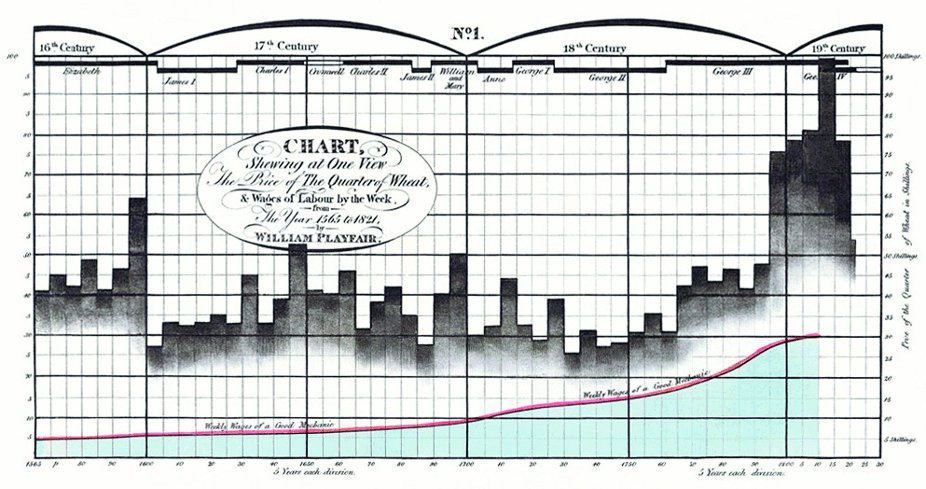
William Playfair’s Tableaux d’arithmétique linéaire, first printed in London and then translated into French around 1787, show colored curves representing annual wheat prices, workers’ wages, etc. [Minard’s facsimile, is Plate IV Fig. 2, above, with a similar Playfair chart from 1821, below].
At first glance, [Playfair’s] wheat prices appear similar to my graphic tables: there are rectangles. But their areas have no statistical significance, while those of my transport route rectangles show the number of tons carried per kilometer. It is such an important metric for traffic that its number is always recorded in the reports.
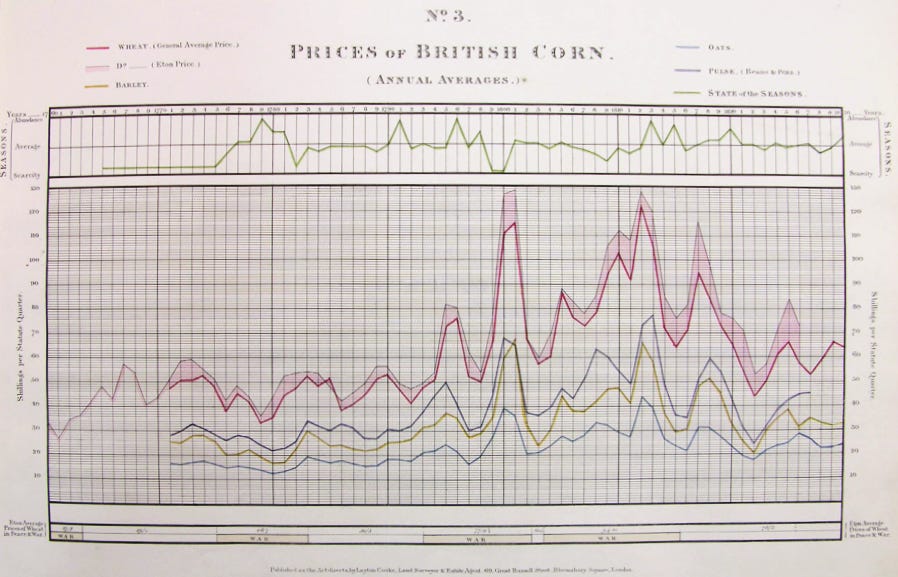
At the beginning of this century, Layton Cooke published his large tables of colored curves representing the annual prices of wheat, wool, meat, butter, etc. in northern Europe [Cooke example below].
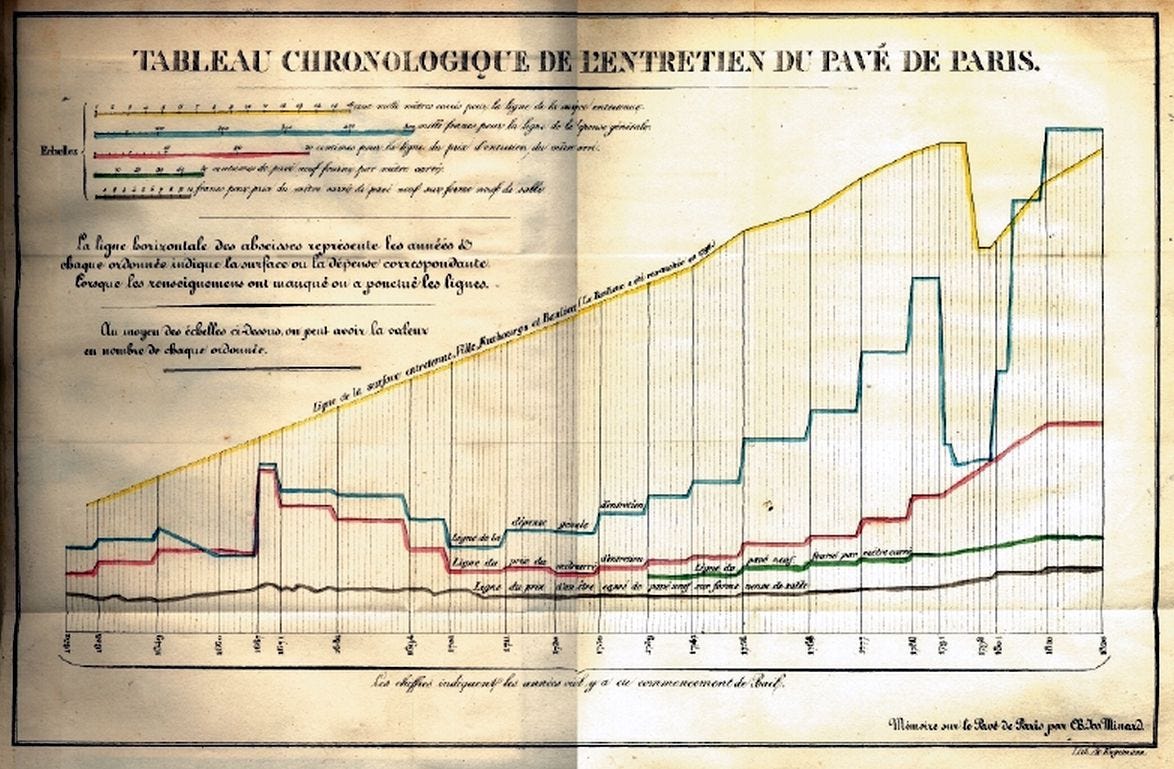
In 1826, I published, using the same system, the various elements of the maintenance of the paving stone of Paris during the last two centuries.
In 1833, still in the same system, Tarbé published tables showing daily deaths in Paris during the cholera of the previous year [Jean Bernard Tarbé de Vauxclairs graphic work on 1832 cholera epidemic was also acknowledged by Marey].
Most engineers recorded daily river water levels in the same way.
These are, among many other applications, those that have been made and are still being made by extending the system indicated by Descartes; but it must be recognized that, whenever the data collected simultaneously have no relationship between them, such as the quantities of goods passing through a canal and the distances they have travelled, the Descartes system has no economic significance nor graphic possibility. Another mode of representing statistical facts was required to compare them by sight alone.
As for my maps, I have heard people say that expressive maps have been made for a long time. However, not only do my maps speak, they count and they calculate for the eye. This is the crucial point; this is the improvement that I have introduced into my figurative maps by the width of the areas, and into my graphic tables by the rectangles.
Other more or less curious representations have appeared in recent years. For example, the number of days with the same prevailing winds in a port was grouped around a compass rose [Minard’s facsimile, Plate IV Fig. 4, above].
In 1827, Baron Ch. Dupin, Senator, and in 1828, Messrs. Balbi and Guerry sought to show the degrees of education and criminality across departments by more or less dark shading [Minard's facsimile, Plate IV Fig. 1, above]; this very ingenious representation was not imitated, probably because it does not give a numerical evaluation. We can say that one shade is darker than another; that is obvious. But to say that it is two or three times as dark is not visible, it is not readable.
As a way of counting by shades, let me mention, and only by analogy, the ingenious process of chemical analysis of water due, I believe, to Gay-Lussac. [French scientist Joseph Louis Gay-Lussac was known for many achievements including his discovery that water is made of two parts hydrogen and one part oxygen.]
In twelve glasses containing the same quantity of distilled water, one dissolves increasing amounts of salt. By pouring in the same quantity of reagent one gets twelve precipitates of increasing intensity. Carrying out the same operation on the water sample to be analyzed gives a precipitate that one can compare to the initial twelve. By conducting the same operation, it is conceivable that two precipitates will have very close to equal color values, which will give the quantity of salt sought. But it is by the equality of color value (which the eye does not mistake), and not by different [salt] intensities, that one obtains a numerical solution.
Let’s return to graphic representations.
Statisticians divided a circle circumference into 365 equal parts, extended the radii going along these divisions. Lengths proportional to daily observations were extended from the circle. Then the ends of these lines were united by a curve, giving a circular representation of all the observations during the year. This is how the weekly revenues of the Western Railway were calculated in 1858 [Minard’s facsimile, Plate IV Fig 3., above].
I saw this mode of representation in the statistical office of the Northern Railway as early as 1846.
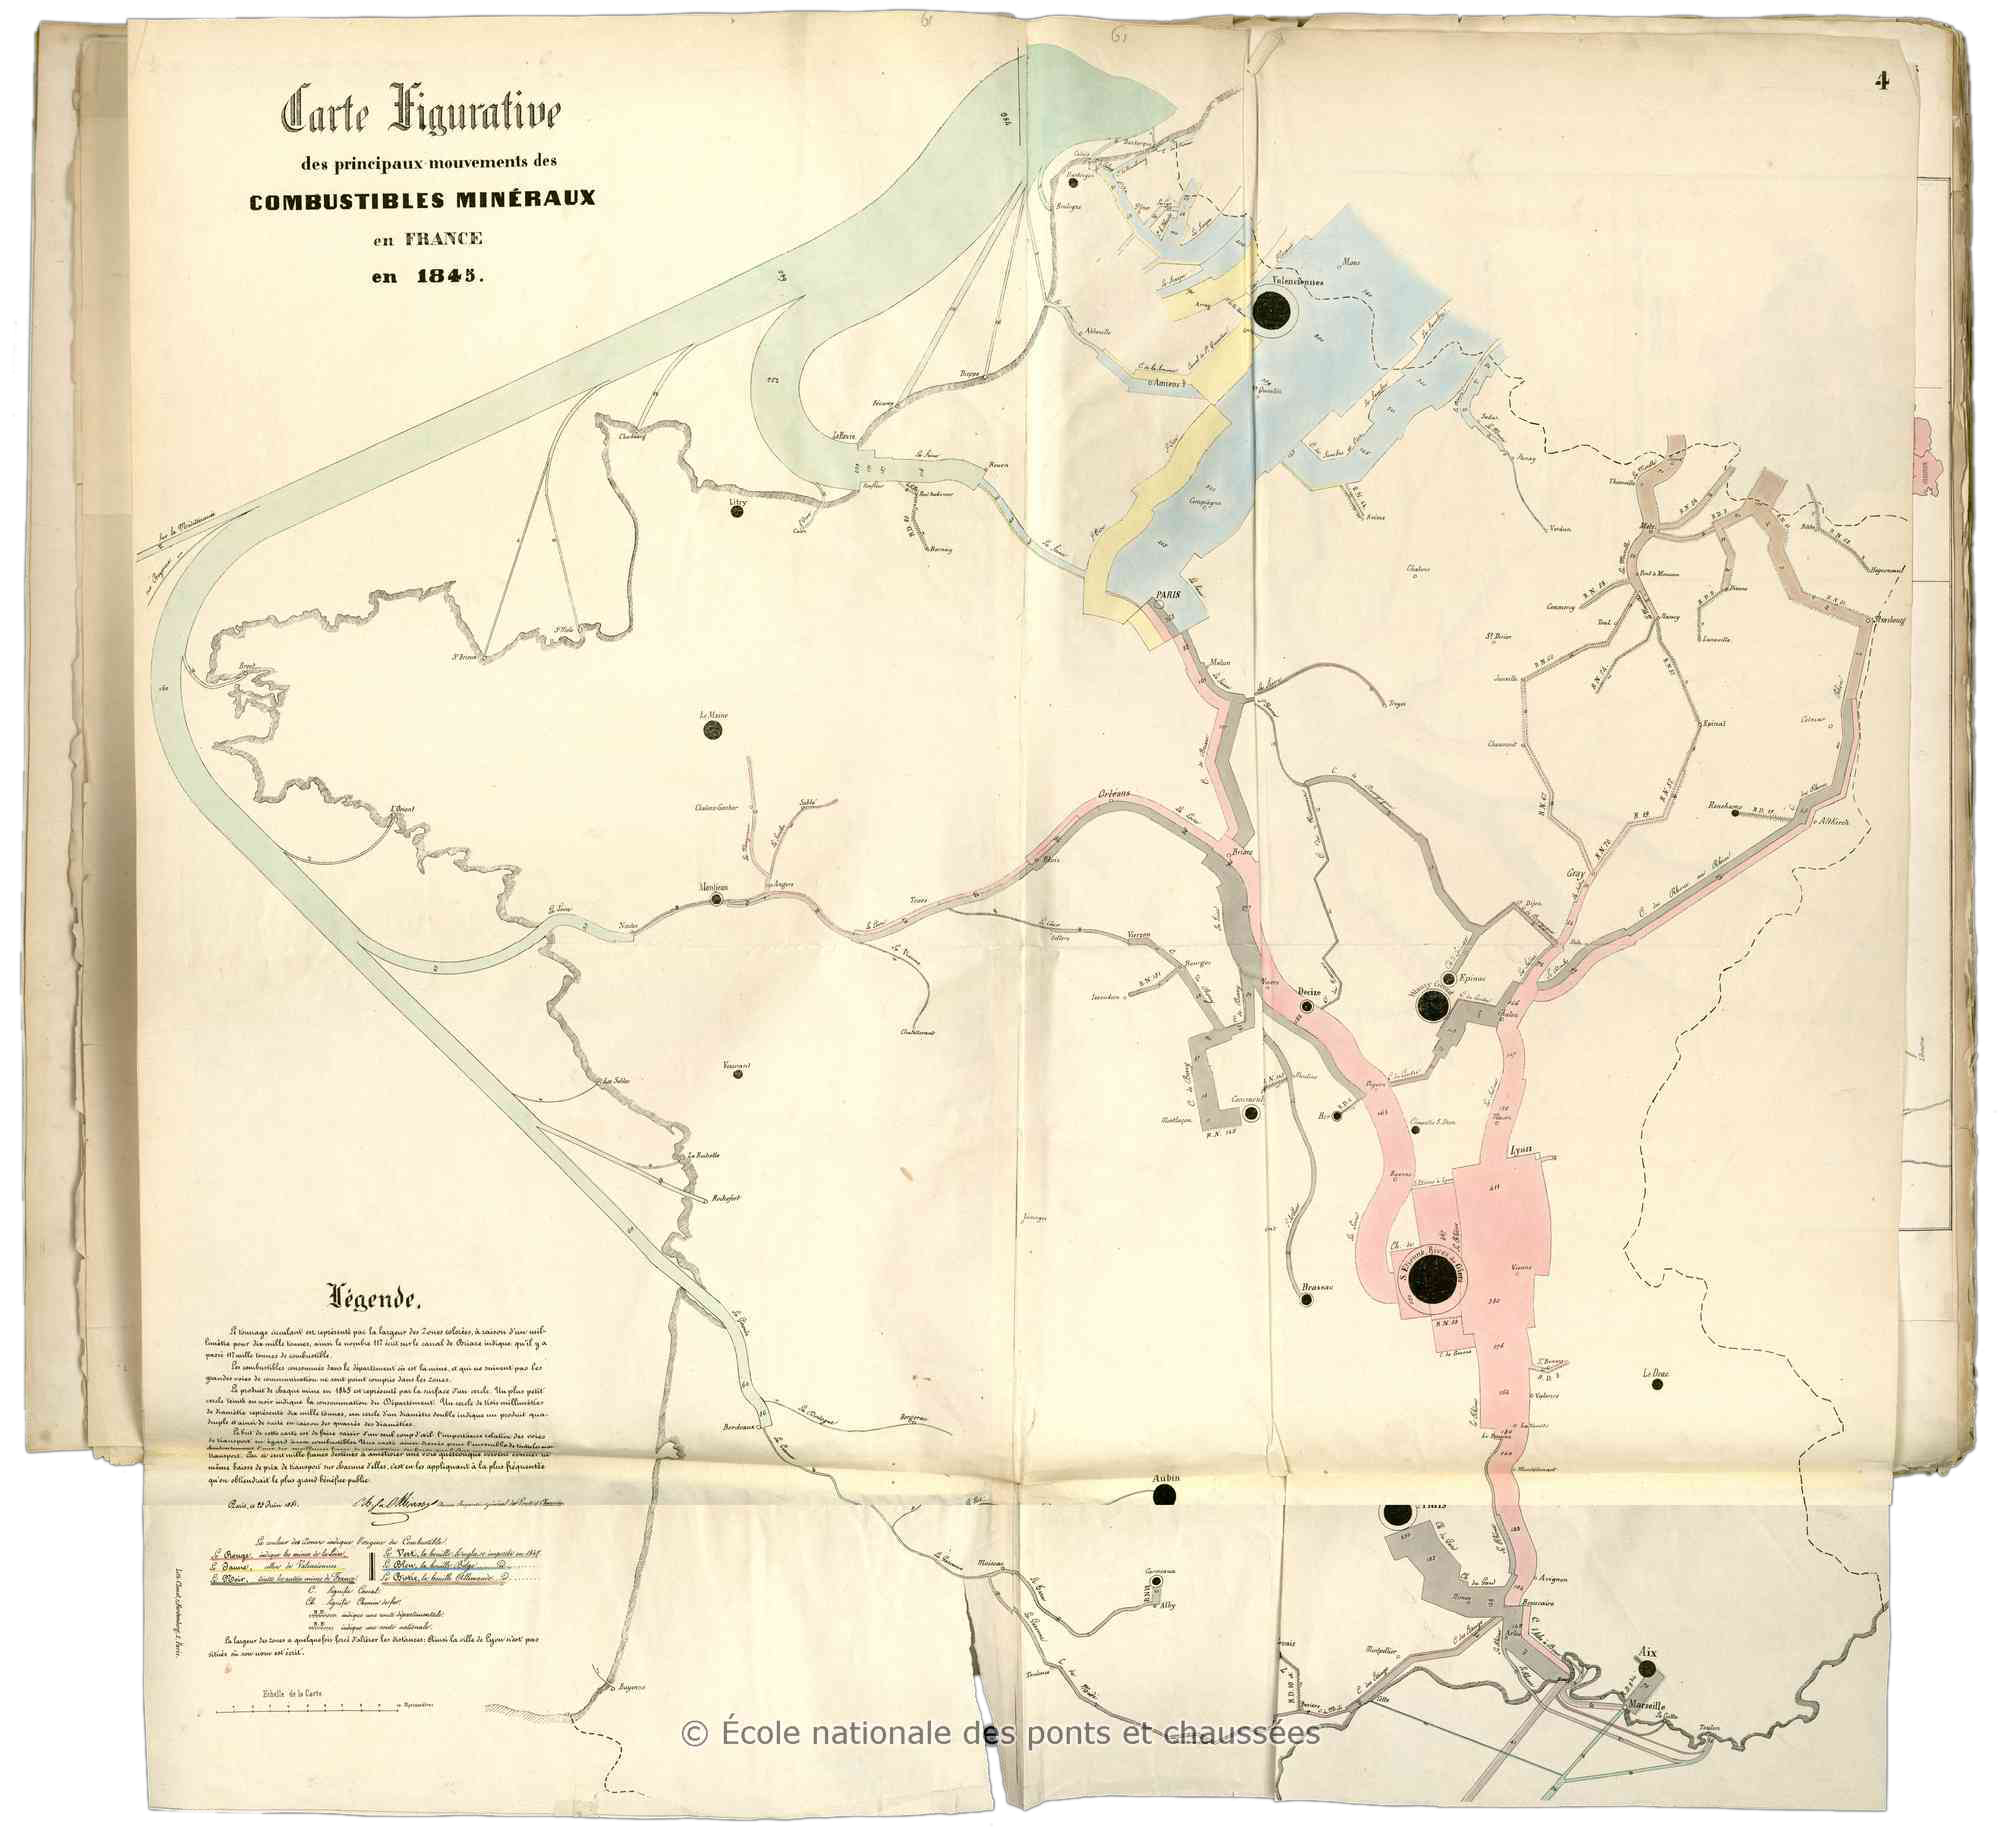
In 1851, I used proportional circle areas to represent coal mine production [below]…
… and in 1852, to represent port tonnages [below]. Since this latter representation placed ports with some geographical accuracy, it allowed for comparison by size and position.
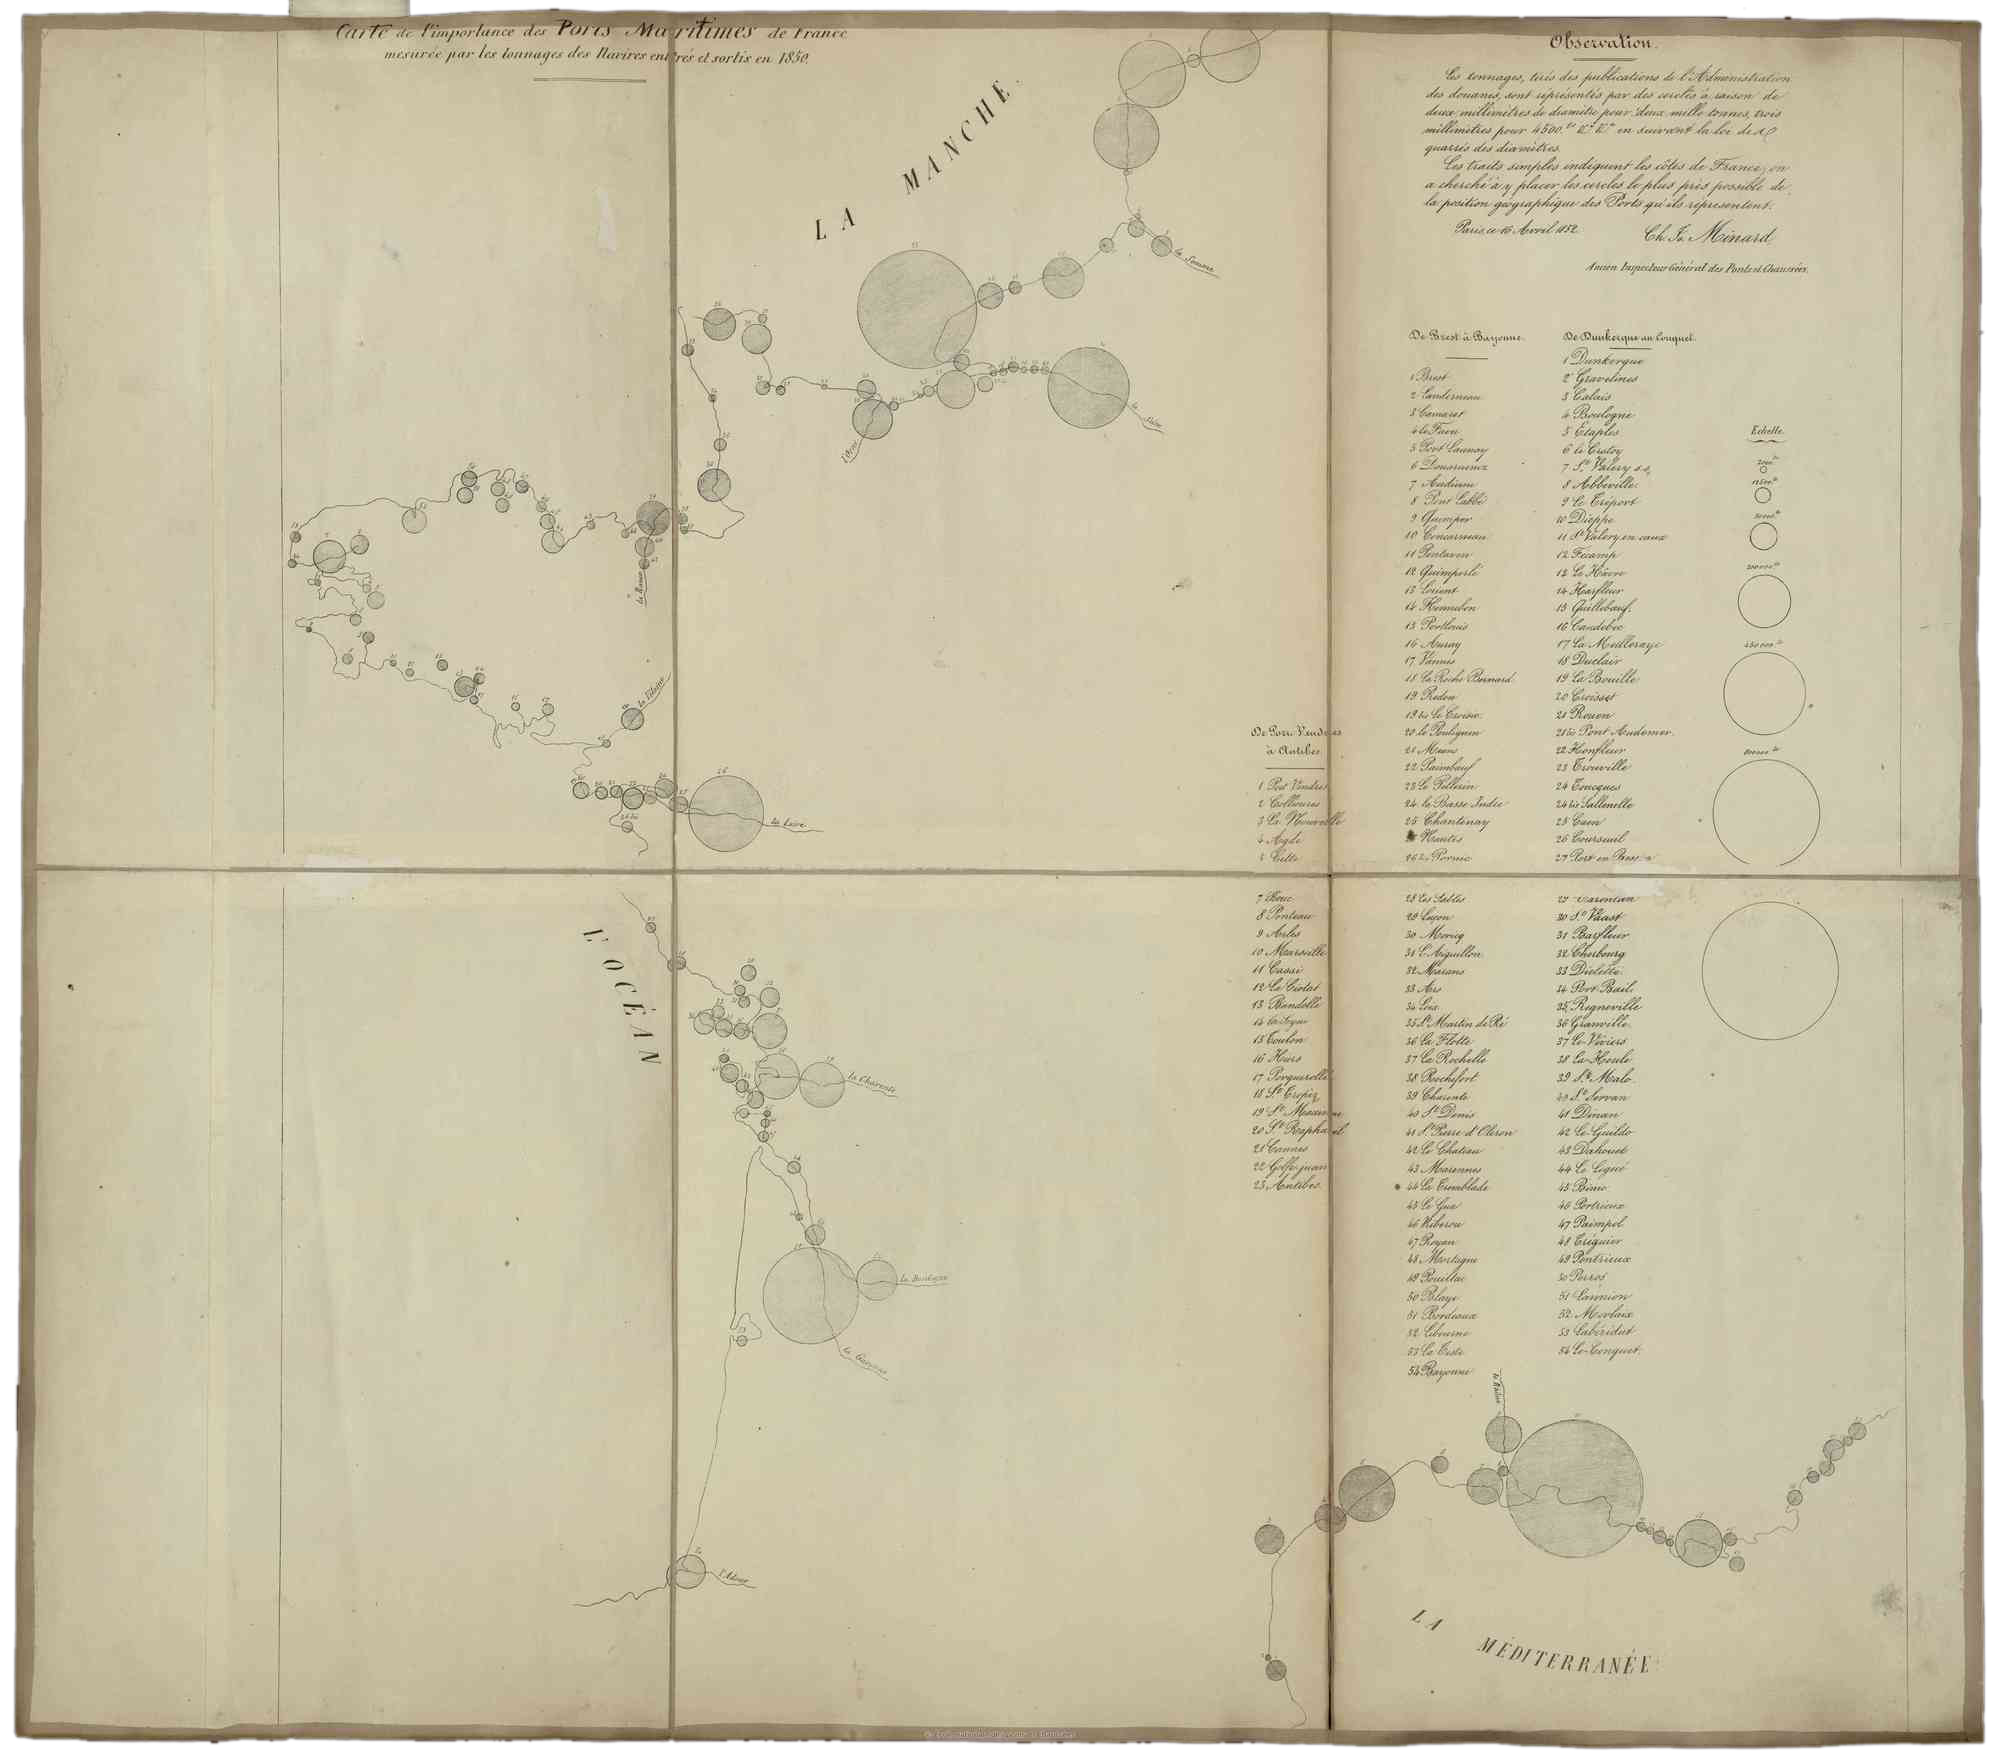
The representation by circles leaves much to be desired. By sight alone, it is very difficult to grasp the ratio of the areas of two circles. One must, in a way, go through the evaluation of the diameters whose squares give the ratio of the circles.
But if separate circles are hard to compare, it is easy to compare sectors of the same circle. That is why I used circle sectors to show the tonnage ratios of each port in my map of sea port tonnages in 1857 [below]. One sector represents cabotage [domestic transport, black] and the other foreign trade [blue]. Circle sectors had already been used before I made use of them [William Playfair introduced the pie chart in his Statistical Breviary (1801) and elaborated its use in 1805.].
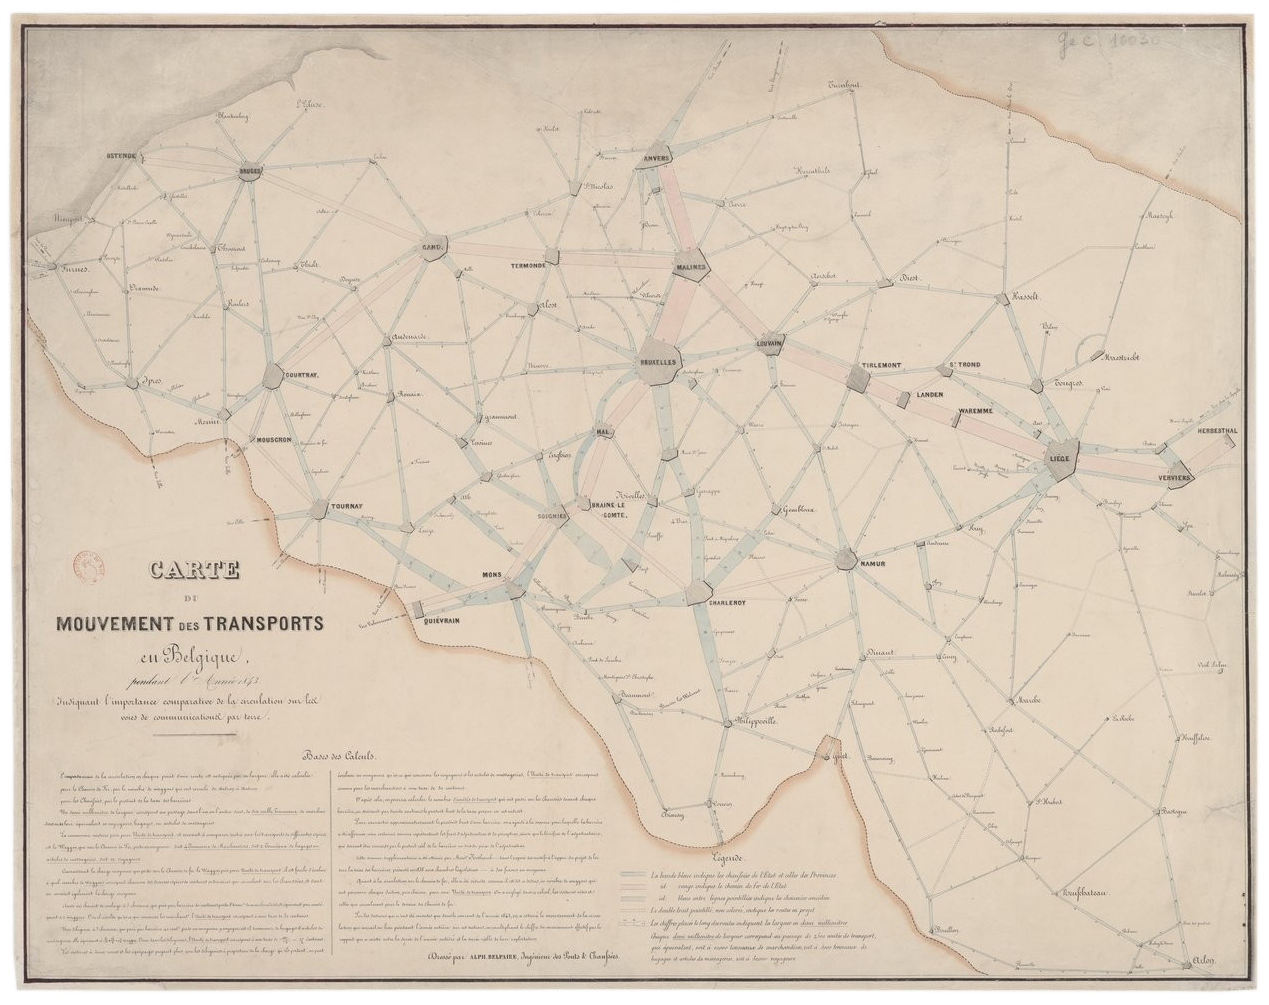
In February 1847, Alphonse Belpaire, a Belgian engineer, published a notice on his beautiful figurative maps (undated) of the roads, rivers and railways of Belgium, drawn up absolutely in the same system as that of my maps. Belpaire says in this notice that his first map [below] appeared about two years earlier, around February 1845. This is the same this time that I published my first figurative map. Thus, if Belpaire’s assertion is accepted, the two inventions arose at the same time, in Belgium and France.
My publications were imitated more or less immediately. Having sent my 1845 colored graphic table on the Central Canal trade [see Plate III in part 1] to Mr. Comoy, then in charge of that canal, this chief engineer found the idea so good that he continued it, and every year since 1851 he has published graphic tables that imitate mine. He has only added, still following my system, the representation of the size of canal ports.
In a circular dated 20 December 1854, the Civil Engineering Administration recommended the application of Mr. Comoy’s (i.e. my own) graphic tables to the main navigable lines, and this recommendation was followed.
In 1856, Mr. Nicolas, engineer of bridges and roads, compiled interesting graphical tables showing various circumstances under which our railways have operated since their inception. In 1857, Garella, Chief Mining Engineer, published a graphical chart of passenger movement on the western railway network. One of the most successful applications of my figurative map system was made in 1859 by the Chief of Railway Statistics of the Ministry of Public Works; it shows the movement and number of troops sent to the Italian War in 1859. Most recently, the Civil Engineering Administration, adopting my system, published a large 12-sheet figurative map of imperial road traffic in 1856–1857.
In recent years, railway companies have adopted my graphical tables to represent their low-speed traffic. The Orléans company considered a particular aspect of my system, deemed it excellent from the point of view of administration; but it is not up to me to comment on their modifications.
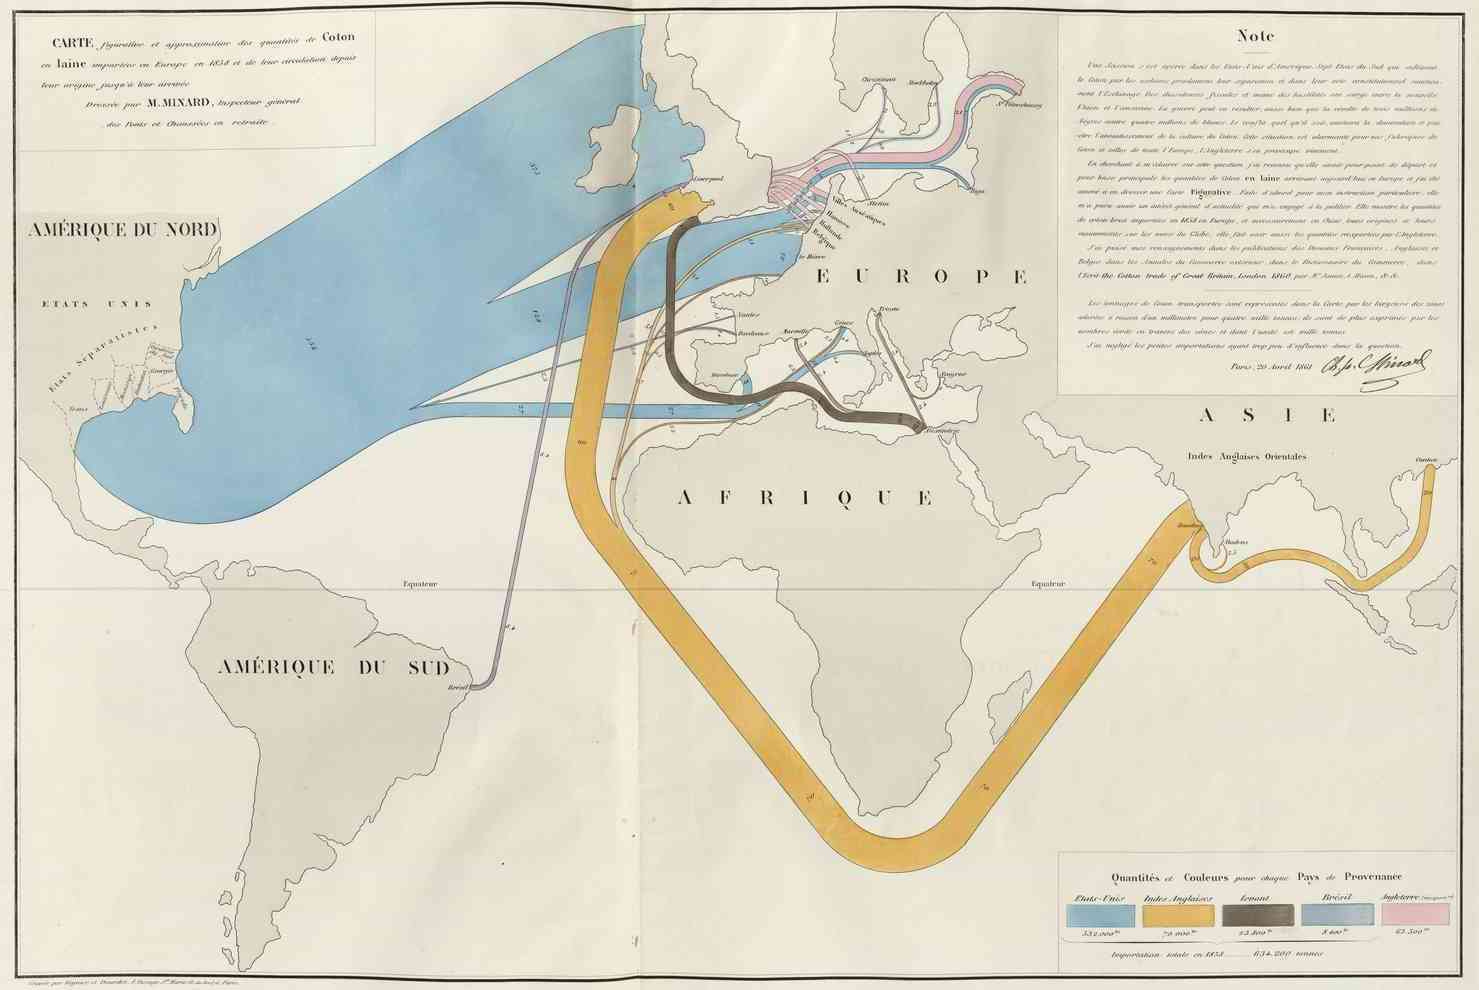
His Excellency the Minister of Agriculture, Trade and Public Works, on the enlightened and benevolent presentation by the Director General of Highways and Railways, was pleased to accept most of my maps. I was able to publish a total of nearly ten thousand copies, graphic tables and maps on various subjects such as passenger traffic on roads and railways; freight traffic in general, and in particular coal, cereals and wine, by water and by rail tonnages of sea ports in France, Europe and world-wide, the consumption of meat in Paris, goods transiting through France and recently the import of raw cotton into Europe, etc., etc.
My figurative maps and graphic tables having been presented to the Emperor [Napoleon III], His Majesty was kind enough, in accepting them, to let me know “that he had viewed them with interest and that he would make use of them.”
Strengthened by this august commendation given to my publications, which are so well received in France and abroad, I feel, at over eighty years old, the satisfaction of having given birth in my old age to a useful idea, of having propagated it through many applications, and of thus still doing some service at the end of my career.᠅
Charles Joseph Minard (1781–1870) was a French civil engineer and professor known for his significant contribution in the development of numerical data on geographic maps, especially flow maps.
This translation was first published at InfoWeTrust.com. I am grateful to William Berg, Professor Emeritus as Wisconsin-Madison, for improving this translation effort.
Translation ©2019, 2025 RJ Andrews. All rights reserved.
Let me know if you can help improve this translation, or have suggested entries for future editions of THE SUMMER OF CLARITY.
About
RJ Andrews helps organizations solve high-stakes problems by using visual metaphors and information graphics: charts, diagrams, and maps. His passion is studying the history of information graphics to discover design insights. See more at infoWeTrust.com.
RJ’s book, Info We Trust, is currently out now! He also published Information Graphic Visionaries, a book series celebrating three spectacular data visualization creators in 2022 with new writing, complete visual catalogs, and discoveries never seen by the public.